UPFINA's Mission: The pursuit of truth in finance and economics to form an unbiased view of current events in order to understand human action, its causes and effects. Read about us and our mission here.
Reading Time: 5 minutes
The November retail sales report showed yearly growth improved modestly, but missed estimates across the board. It wasn’t as strong as what the consumer sentiment index, the Adobe analytics data, and the Gallup poll, which asked what consumers would spend on the holidays in October, suggested it would be. Plus, there are low jobless claims, a low unemployment rate, a high demographically adjusted labor force participation rate, a high stock market, and strong real wage growth for production and non-supervisory workers.
This report could have been hindered by the late Thanksgiving. There were 6 fewer post-Thanksgiving shopping days in November. Cyber Monday was pushed into December instead of being in November like it was last year. This report is seasonally adjusted, but it’s not impossible for the timing of Thanksgiving to have had an impact. The adjustment could have been affected by how much share of retail sales online has. Either that, or the Adobe Analytics data was too exuberant.
Unfortunately, we need to wait for the December report to see if this theory holds any water. We will be able to tell by the revision to the November data and the December report. Either November’s sales growth will be revised higher or December will have very strong growth. On a yearly basis, December has an easy comp, so sales growth will spike either way. We will be looking at the 2 year growth stack to measure its strength and to determine if it was helped by Cyber Monday. Remember, the length of the shopping season doesn’t guarantee results one way or the other. The very long shopping season last year had terrible sales growth in December after starting off okay.
Monthly Growth Misses Estimates
On a monthly basis sales growth missed the the low end of the expected range across the board. On the positive side, October growth was revised slightly higher. Headline monthly retail sales growth was 0.2% which missed estimates for 0.5% and the low end of the estimate range which was 0.3%. October growth was revised up 0.1% to 0.4%. Monthly growth excluding autos was 0.1% which missed estimates for 0.4% and the low end of the expected range by 0.1%. October growth revised up 0.1% to 0.3%. The sequential improvement in motor vehicle sales didn’t lead to yearly growth improvement in motor vehicle and parts sales growth. Yearly growth fell from 5.19% to 4.88%.
Excluding autos and gas, monthly sales growth was 0% which missed estimates for 0.4% and the low end of the consensus range by 0.2%. Growth was revised up again; this time by 0.2%. Yearly gas prices faced much easier comps. This is the same reason energy inflation increased in the CPI report. Finally, monthly control group sales growth fell from 0.3% to 0.1% which missed estimates for 0.4% and the low end of the estimate range by 0.1%. Yearly control group sales growth fell from 3.99% to 3.17%. This is the segment of the report that goes into GDP growth. We will discuss this report’s impact on GDP growth estimates later in this article.
Online Sales Growth Falls (A Clue?)
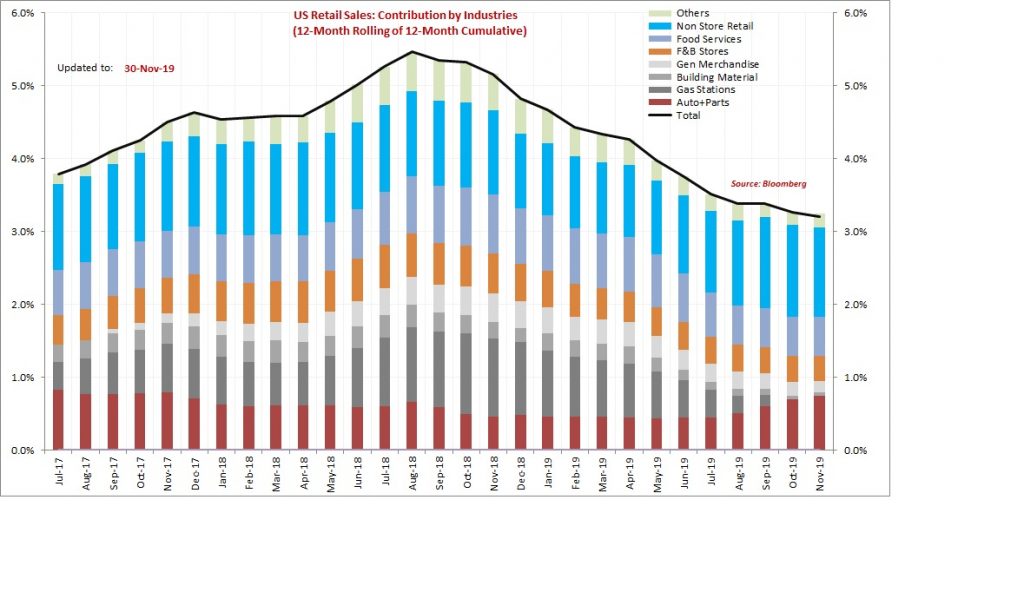
If this report was weakened by Cyber Monday being pushed to the next month, you’d expect yearly online sales growth to fall which is what happened. The Adobe Analytics data showed Black Friday online sales growth was 22.3%, Small Business Saturday sales growth was 18%, and Cyber Monday growth was 16.9% (that’s $9.2 billion in sales on one day). In the retail sales report, monthly growth fell from 1.4% to 0.82% and yearly growth fell from 13.69% to 11.5%. As you can see from the chart below, online sales contribute the most to growth, making this segment pivotal. It has the highest growth and has a 12.8% weighting which is the 2nd biggest (1st is autos and parts) in the report.

Yearly Growth & Specifics Of The Report
Yearly nominal retail sales and retail sales excluding food services growth improved 0.1%, but their 2 year growth stacks fell. Total yearly retail sales growth was up from 3.2% to 3.3%, but the comp fell 0.7%, which means the 2 year stack was 0.6% weaker. Excluding food services growth rose from 3% to 3.1%, but the comp was 0.5% weaker, which means the 2 year stack fell 0.4%. Since CPI rose 0.3% because of oil prices and yearly retail sales growth improved just 0.1%, yearly real retail sales growth fell from 1.45% to 1.28%. That was the lowest growth rate since May. Growth troughed at -0.53% last December. That gives you an idea of how weak December was.
Sales growth at gas stations was up because of the easier energy comp we mentioned. Yearly growth increased from -4.3% to 0.54%. Yearly restaurant sales growth increased 1 basis point to 5.07%. However, general merchandise sales growth fell from 0.36% to -0.13%. This is in line with the initial data which showed sales at brick and mortar stores fell 3% on Thanksgiving and Black Friday combined.
Updated GDP Forecasts
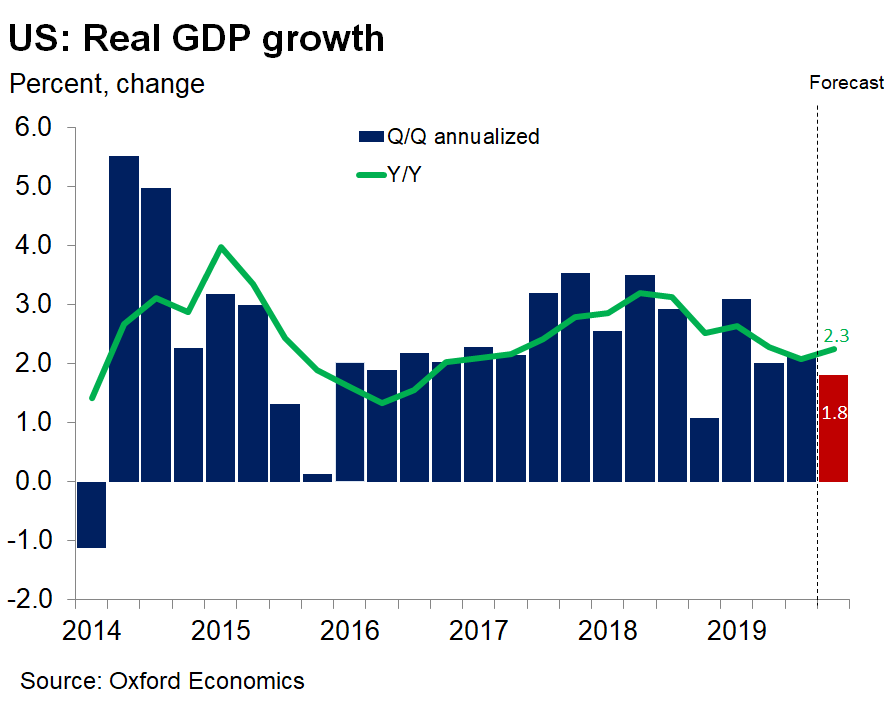
This retail sales caused most GDP growth estimates to fall, but not by as much as you’d think. You’d think there would be a big decline because growth missed the low end of the consensus range and the consumer was supposed to carry growth since business investment is falling. Oxford Economics only lowered its estimate for PCE growth by 0.2% to 1.7%. The chart below shows it lowered its GDP growth estimate one tenth to 1.8%.
Yearly growth is expected to increase to 2.3%. Goldman Sachs lowered its Q4 quarterly growth estimate by the exact amount and has the exact forecast. Both are in line with the median estimate.
Now let’s review the regional Fed Nowcasts. The Atlanta Fed Q4 GDP Nowcast stayed at 2% because the decline in its estimate for the real PCE growth was canceled out by the upwardly revised estimates for real government spending growth, real private inventory investment, and real net exports. The usually optimistic St. Louis Fed Nowcast sees 2.04% growth. The NY Fed Nowcast increased 0.11% to 0.69%. The retail sales report pushed it higher by 7 basis points. That shows how negative the previous estimate for real consumption growth was. The NY Fed’s Q1 estimate increased to 0.82% from 0.66%. If that growth rate is hit, the stock market is wrong to rally. The market is projecting an acceleration, not sub 1% GDP growth.
Conclusion
It’s really surprising to see such weak retail sales growth. This report wasn’t a disaster, but online sales growth fell which wasn’t what the Adobe Analytics data implied. Let’s see if this report is revised or the December reading is very strong. Investors completely ignored this report as stocks stayed at their record highs. Most Q4 GDP growth estimates remain below 2%. Investors are looking towards 1H 2020 and ignoring the potentially weak 2H 2019.
Have comments? Join the conversation on Twitter.
Disclaimer: The content on this site is for general informational and entertainment purposes only and should not be construed as financial advice. You agree that any decision you make will be based upon an independent investigation by a certified professional. Please read full disclaimer and privacy policy before reading any of our content.


