UPFINA's Mission: The pursuit of truth in finance and economics to form an unbiased view of current events in order to understand human action, its causes and effects. Read about us and our mission here.
Reading Time: 4 minutes
2019 was a costly year for future returns if you believe that when valuations get more expensive, it lowers future returns. That’s because almost all of the gains came from multiple expansion and not from earnings. Earnings barely increased and stocks had an amazing year. According to FactSet, S&P 500 earnings growth was 0.3%. The index was up 27.31% year to date as of December 16th. That’s a lot of multiple expansion. Also, according to FactSet, the forward PE ratio is 17.8 which is above the 5 year average of 16.6 and the 10 year average of 14.9. Some investors don’t like to admit this, but stocks were cheap in December 2018 as the forward PE multiple fell to about 13.5. The initial rally was about recognizing that a recession wasn’t coming and that the Fed would ease policy. The last leg of the rally this year has put stocks at expensive levels relative to the 5 year average.
As you can see from the chart above, the rally since March 2009 has mostly been about earnings growth as multiple expansion only accounted for 32% of the gains. Keep in mind, stocks were very cheap in March 2009. Even starting at that level, most of the gains have come from EPS growth. 2019 has been the opposite as 92% of the gains have come from multiple expansion. Because the multiple has gotten so high, it seems unlikely for it to drive 2020 gains. With FactSet’s projected 5.5% EPS growth in 2020, it seems likely a below average year of returns is coming.
Which Sectors Got More Expensive?
The chart below breaks down how much each sector’s forward earnings multiple increased. None decreased.
Only healthcare’s was up less than 10%. In 2019, this sector had tied for the best earnings growth as it was 8.3%. This partially explains why healthcare and education services have dominated job creation this year. Its performance in 2020 will depend on the 2020 election. If either Sanders or Warren (2nd and 3rd place in the average of primary polls) win the primary, there will likely be increased volatility in the sector.
The tech sector has had the biggest multiple expansion. That’s because it has had a great year despite its earnings falling 0.1%. The XLK ETF is up 45.29% year to date. Apple has led the charge as its forward PE multiple has almost doubled since its December bottom. It is now at 21.3 which is the highest level since April 2010. Remember, the 77.22% gains were helped by buybacks, but buybacks lower multiples. It became more expensive because of investor optimism. Tech has liked phase 1 of the trade deal being completed and is expecting the global economy to improve in 2020 due in part to the global central bank rate cuts.
The Earnings Scout Says Stocks Are Expensive
The Earnings Scout uses its own earnings data which is different from FactSet’s. It too shows stocks have gotten expensive. At the start of 2019 stocks were cheap as the forward 1 year PE multiple was only 13.92. As we mentioned, the rally from the bottom in December 2018 into the first few months of 2019 was just about stocks getting back to their typical valuations. The rally in the middle of the year started to price in an economic growth acceleration in 2020 after a somewhat weak 2H 2019. Stocks started to get expensive in the fall of 2019. As you can see, the PE multiple has increased from 14.52 to 17.67 in one year. Stocks won’t start 2020 cheap like they started 2019.
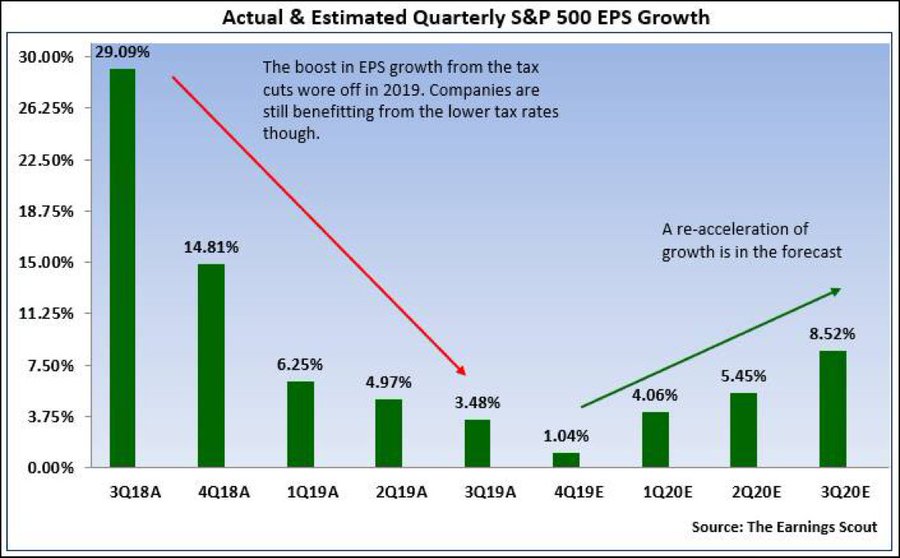
As we mentioned, FactSet shows EPS growth will be 5.5%. Those estimates will fall as the results get closer to being reported, but then firms will likely beat those lowered estimates. Mid-single digit earnings growth might not be far off from how results turn out. If economic growth accelerates due to the Fed rate cuts in 2019, we could see higher EPS growth. The chart below shows expected non-GAAP EPS growth each quarter.
Growth is expected to bottom in Q3 2019 in part because of easier comps. Q3 2019 needed to compete with 29.09% growth while Q3 2020 needs to compete with just 3.48% growth.
Notice that we said EPS growth is expected to bottom in Q3 2019. That’s because current Q4 growth estimates are higher than Q3 estimates were 3 months ago. Expectations were for negative growth before results started coming in. With most Q4 earnings reports coming out in about a month, growth estimates likely won’t fall below zero. Earnings estimates usually don’t change much in the third month of the quarter because earnings reports impact estimates and not many reports come out in the third month.
The Best Decade Since The 1950s
The 2010s followed a terrible decade for stocks as there were two declines of over 50% in the 2000s. The dot com bubble bust was early in the decade and the 2008 financial crisis was late in the decade. The 2010s taught us how uncommon 50% crashes are if we didn’t already know by studying history. There were no recessions in the 2010s and the decade started off with relatively cheap valuations.
This explains how its Sharpe ratio was 1.01 which was the best since the 1950s. As you can see in the chart below, the 2000s Sharpe ratio was -0.23 which was the worst since at least the 1930s. The 2000s was a very uncommon decade.
The 2010s was an above average decade for sure, but usually the Sharpe ratio is solidly positive. Stocks will start the next decade having avoided a recession for over 10 years and with expensive valuations. Keep in mind, it’s much tougher to determine what will impact stocks in the next decade than in the next year.
Conclusion
Stocks will be starting 2020 in relatively expensive territory. This doesn’t mean stocks will have an awful year. If economic growth accelerates, then earnings estimates might be too low. If EPS growth is in the high single digits, 2020 won’t be a bad year. However, it’s tougher for stocks to do well this coming year than this past year because their forward PE ratio is almost 4 points higher.
Have comments? Join the conversation on Twitter.
Disclaimer: The content on this site is for general informational and entertainment purposes only and should not be construed as financial advice. You agree that any decision you make will be based upon an independent investigation by a certified professional. Please read full disclaimer and privacy policy before reading any of our content.


