UPFINA's Mission: The pursuit of truth in finance and economics to form an unbiased view of current events in order to understand human action, its causes and effects. Read about us and our mission here.
Reading Time: 5 minutes
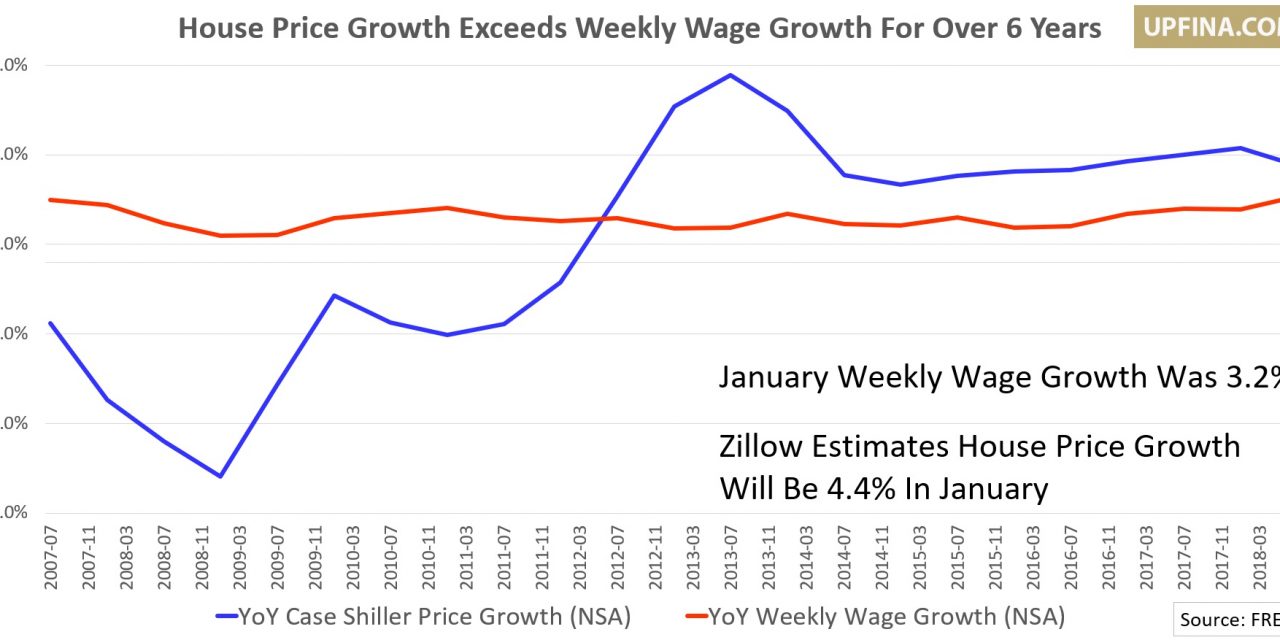
Housing price growth according to Zillow’s estimate is expected to be 4.4% in January which would be the lowest growth since July 2015. Investors must be wondering when price growth will stop falling. On the other hand, consumers are still wondering when homes will be affordable again. Affordability varies dramatically across the country, as housing is the most affordable in the Midwest and the least affordable in cities like San Jose. Even in New York housing is starting to become more unaffordable because property taxes are being raised and the new federal tax law limits the SALT deduction to $10,000.
The easiest place to look when determining when price growth will stop falling is wage growth. As you can see from the chart below, the Case Shiller home price index has been increasing quicker than weekly wage growth (both non-seasonally adjusted) for over 6 years.
The gap has been starting to close as the tightening labor market is increasing wage growth and the weak housing market is lowering house price growth. January’s weekly wage growth was 3.2%, so there’s still a 1.2% gap between house price growth and weekly wage growth. That means there is still room for home price growth to fall.
It’s important to mention that declining mortgage rates will help housing prices. The 30 year mortgage rate peaked at 4.94% in November and is currently at 4.35%. The MBA purchase applications index increased 3% from last year in the latest report. Price growth is falling even though there is a solid labor market. It will fall quicker if jobless claims increase. In the latest reading, claims increased 8,000 to 225,000 (which is still very low), but the 4 week average fell 7,000 to 229,000. The survey for the BLS monthly labor report occurred in the week where there were 217,000 claims, so the BLS report should be strong.
Even with slowing price growth and declining interest rates, the very positive February consumer sentiment report showed plans to purchase a car/truck and a house both were the lowest since July. Keep in mind, the worries about the declining stock market and government shutdown passed by the time this survey took place, so declining buying plans are true negatives.
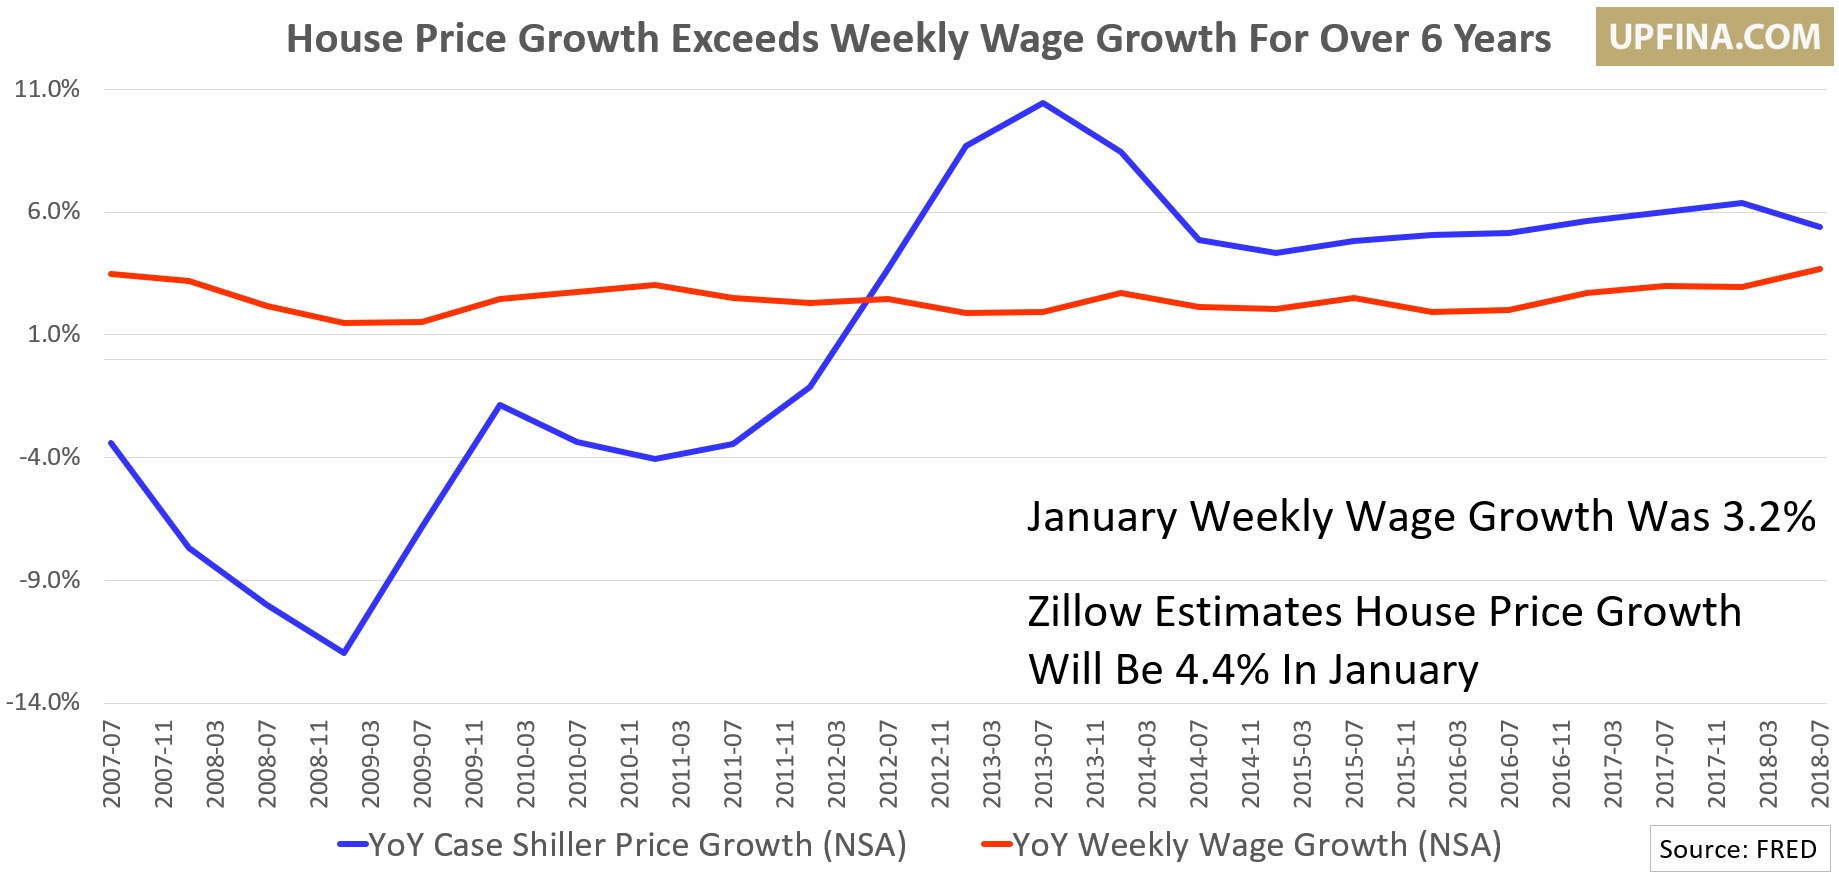
Non-Bank Housing Loans
The chart below looks scary because it shows non-banks are now giving out more mortgages than large banks and small banks combined. However, that doesn’t mean another housing collapse is coming soon.
Most non-banks are loan processors for government agencies. Most of these loans are bound by qualified mortgage law. QM law limits the debt to income ratio to 43%, limits points and fees to less than 3% of the amount borrowed, and doesn’t allow toxic loan features such as being interest only, having negative amortization, terms beyond 30 years, and balloon loans. We have seen loans given to borrowers who are highly qualified this cycle as borrowers have high Fico scores and great cash flow. Don’t let this chart make you think a housing bubble will burst soon.
Changing Auto Market
The auto market must be thought of as an old-line industry which is getting disrupted. Cars are getting expensive, with the addition of technology packages, and ridesharing apps are becoming more accessible. There is also a huge push towards micro-mobility in large cities through the popularization of electric bikes and scooters.
In previous years, investors were distracted by the bright and shiny object that is autonomous cars, and many missed out on the proliferation of electric scooter and bike sharing apps like Lime. America is moving closer to ‘peak car’ especially among younger generations as 26% of 16 year olds had their drivers license in 2017, while almost half had their license 36 years ago. It’s much easier to contact people with a smartphone now, which lessens the need for teens to drive.
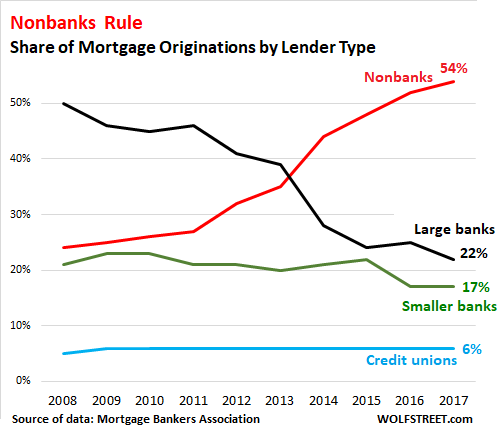
As you can see from the charts below, there are secular shifts in the average age of cars and trucks and the share of household expenditures for new and used cars and trucks.
The average age of cars and trucks increased from slightly above 8 in 1995 to slightly below 12 years in 2018. The share of household expenditures in percentage terms spent on cars and trucks declined from the high single digits in the 1980s to the mid-single digits in the 2010s.
Extreme Auto Borrowing
Demand for cars and trucks is waning as technology and tastes change. That’s being combined with a big auto debt overhang which is more problematic than housing debt. Loans are being given to borrowers with lower Fico scores. The 90+ days delinquency rate on loans is 4.5% as of Q4 2018. That’s quite elevated considering the very strong labor market. Surely, it will beat the previous cycle peak of 5.3% in Q4 2010 if the labor market weakens. The chart below helps explain why delinquency rates are rising.
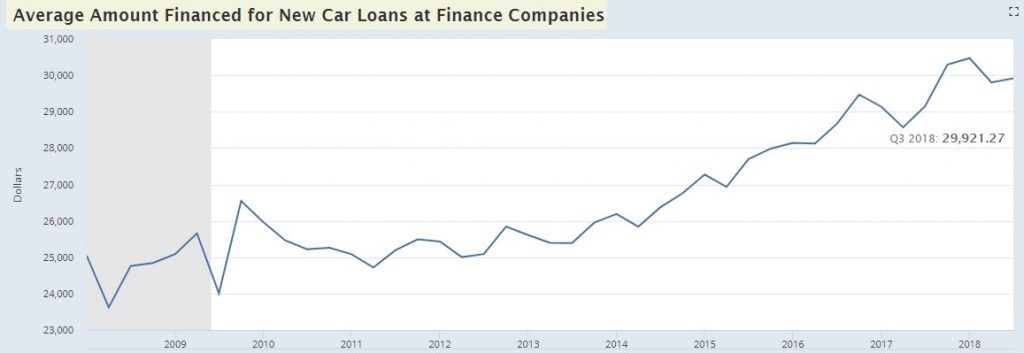
The average amount that’s financed for new cars was $29,921 as of Q3 2018. At the start of this expansion, the average amount was slightly over $24,000. That’s an increase of about 25%. As we mentioned, car companies are stuffing new cars with technology packages which are expensive.
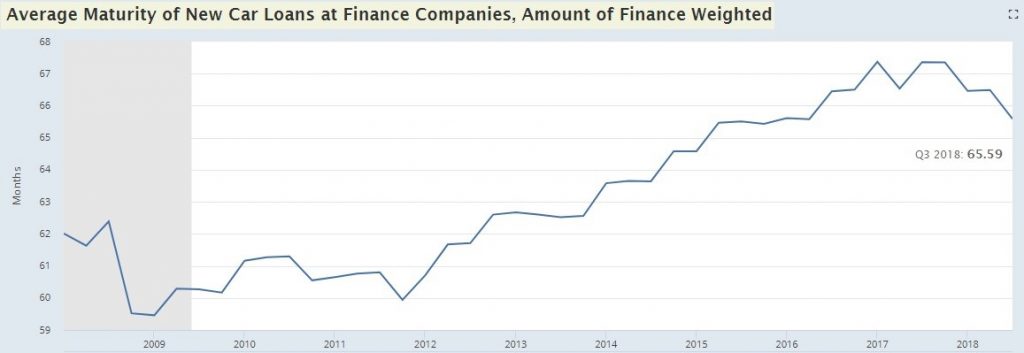
To handle such expensive car loans, the length is being stretched out. As of Q3 2018, the average loan was 65.59 months which is almost 5.5 years. It started the cycle at 60.27 months.
Conclusion
The housing market isn’t in a bubble, but price growth is still above weekly wage growth even though price growth is falling, and wage growth is rising. Based solely on prices and wages, housing is becoming more unaffordable even though the housing market has been weak. The good news is mortgage rate have fallen and the bad news is some areas are seeing big increases in property taxes. The auto sector is in trouble because borrowers have lower Fico scores than homebuyers and the delinquency rates are rising. That weakness is combined with the mega trend of consumers demanding fewer cars as micro-mobility and ride sharing apps gain popularity and eventually autonomous car technology improves to the point where it can become mainstream.
Have comments? Join the conversation on Twitter.
Disclaimer: The content on this site is for general informational and entertainment purposes only and should not be construed as financial advice. You agree that any decision you make will be based upon an independent investigation by a certified professional. Please read full disclaimer and privacy policy before reading any of our content.


