UPFINA's Mission: The pursuit of truth in finance and economics to form an unbiased view of current events in order to understand human action, its causes and effects. Read about us and our mission here.
Reading Time: 4 minutes
It’s important to note that just because the stock market had its best 3 day gain since 1931, doesn’t mean the fundamentals of the economy have improved. Small businesses are still in bad shape because the economy is still shutdown. The number of new daily cases is still increasing each day in America and might do so for another 2 weeks. Just because the economy looks bad, doesn’t mean stocks are necessarily a huge short either. Stocks and the economy are correlated in the long and intermediate term, but anything can happen in the short term with massive volatility. Stocks are being priced based on quickly changing expectations and liquidity right now. If a fund goes under and forces a rush to cash, it has nothing to do with the economy. Let’s not forget about the fundamentals of the economy though. This current economic weakness is why stocks fell 34% in the first place.
Homebase provides us with updated impacts COVID-19 is having on small firms. This is yet another new set of data points we will need to rely on in this new world where monthly data is ancient. Even weekly data like jobless claims get priced in before they are released. Specifically, as of March 25th, hours worked by hourly employees were down 57% yearly. The worst was -62% on the 22nd. There was a 46% decline in local businesses open on the 25th. There was a 59% decline in hourly employees working. This is going to have a massive impact on the April BLS labor report. The March report uses data from the week of March 12th when the economy wasn’t as bad as it is now. The monthly loss of income per employee rose to $1,276 and the U.S.-wide loss of income per month was $61 billion (both as of the 24th).
As you can see from the chart above, hourly small business workers don’t have the money to withstand much time off. 7% can’t last a day without finding new work or borrowing money. Only 8% can last more than 8 weeks which is a disaster because this shutdown might last 8 weeks in the worst hit areas such as New York City.
Jobless Claims Spike
Jobless claims were widely anticipated to be bad. Many thought this would send stocks lower, but stocks rallied sharply. You need to question yourself if you are following a data point that everyone is looking at. Trading isn’t that straight forward. If it was, everyone would make money easily. However, considering how large the spike in claims was, you can say the spike in stocks on one day is almost irrelevant.
You saw in the week of March 21st, the number of initial claims rise from 282,000 to 3.283 million which beat estimates for 1 million and the highest estimate which was 2.737 million. The number of claims was by far a record high in nominal and population adjusted terms. In February, there were 5.787 million unemployed people. We had that number increase 57% in a week. If the unemployment rate rises 57%, it would go from 3.5% to 5.5%.
This week isn’t part of the March BLS reading, so the unemployment rate won’t spike much in that one. If jobless claims stay high, we could be looking at the unemployment rate doubling in one month in April. As you can see from the chart below, this level of initial claims is the equivalent to a 20% U3 rate which would be the highest since the 1930s. It peaked at 24.9% in 1933 (we just saw the biggest 3 day rally since 1931). That high unemployment rate is in tune with the projections for potentially worse GDP growth in Q2 than at any point during the Great Depression.
Very Big Stimulus (It’s A Lifeline)
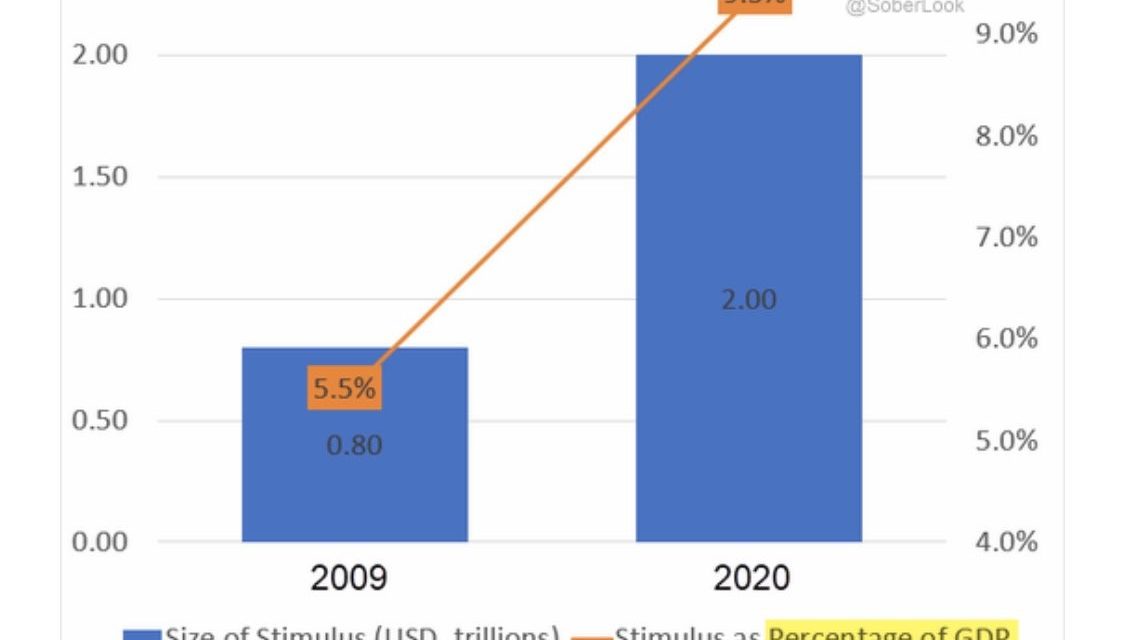
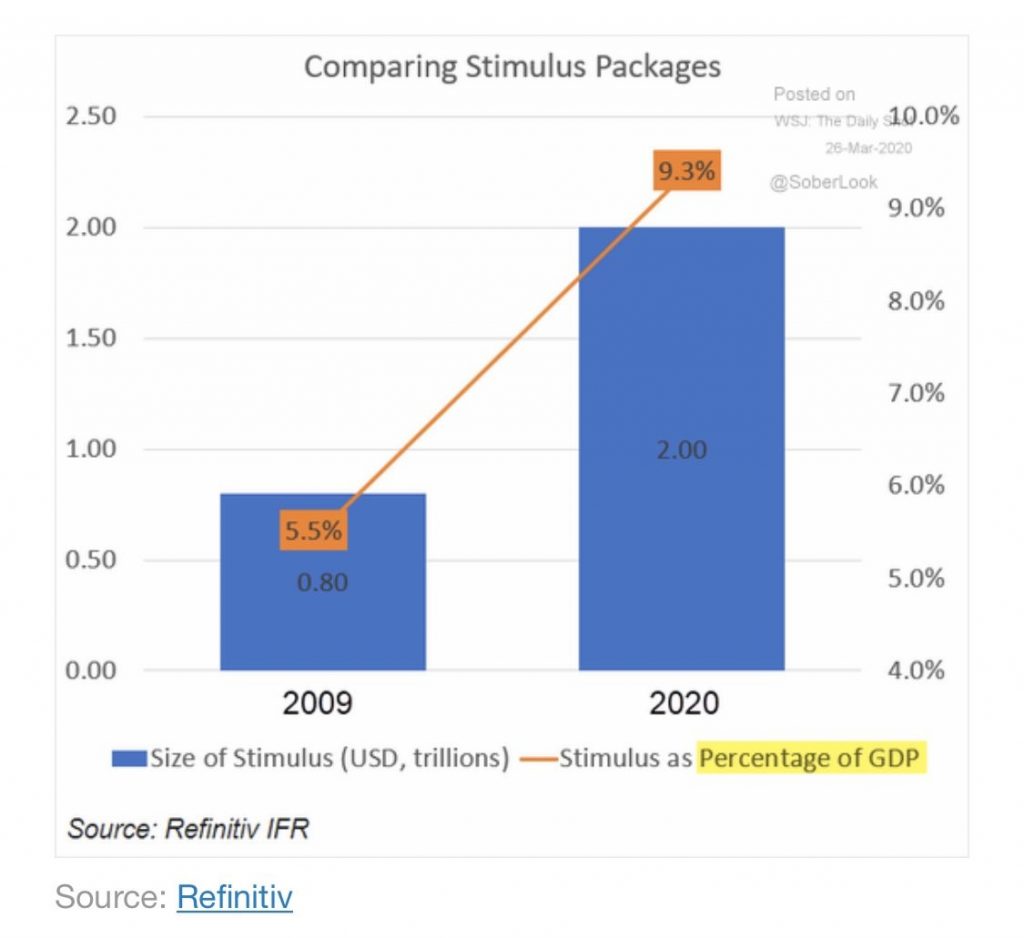
America has decided to fight this recession with both aggressive fiscal and monetary policy. With 2$ trillion from the government and $4 trillion from the Fed, the government has taken an aggressive approach to prevent the economy from complete collapse. As you can see from the chart below, the fiscal stimulus is 9.3% of the economy which is almost double the 2009 stimulus which was 5.5% of GDP. The key difference is the recession was over in 2009, while this package passed before the first terrible jobless claims report came out. That’s because this is a tidal wave. This weakness makes every other recession look like it was in slow motion.
These fiscal and monetary packages aren’t really stimulus. They are lifelines for people and businesses in a desperate situation. As you can see from the chart below, a survey by CivicScience shows that 33% would pay down debt or bills with the government lifelines. 26% would use it to purchase necessities. 27% would save it because not having a job or potentially losing a job creates uncertainty. Only 10% would either treat themselves or invest it.
Global Stimulus
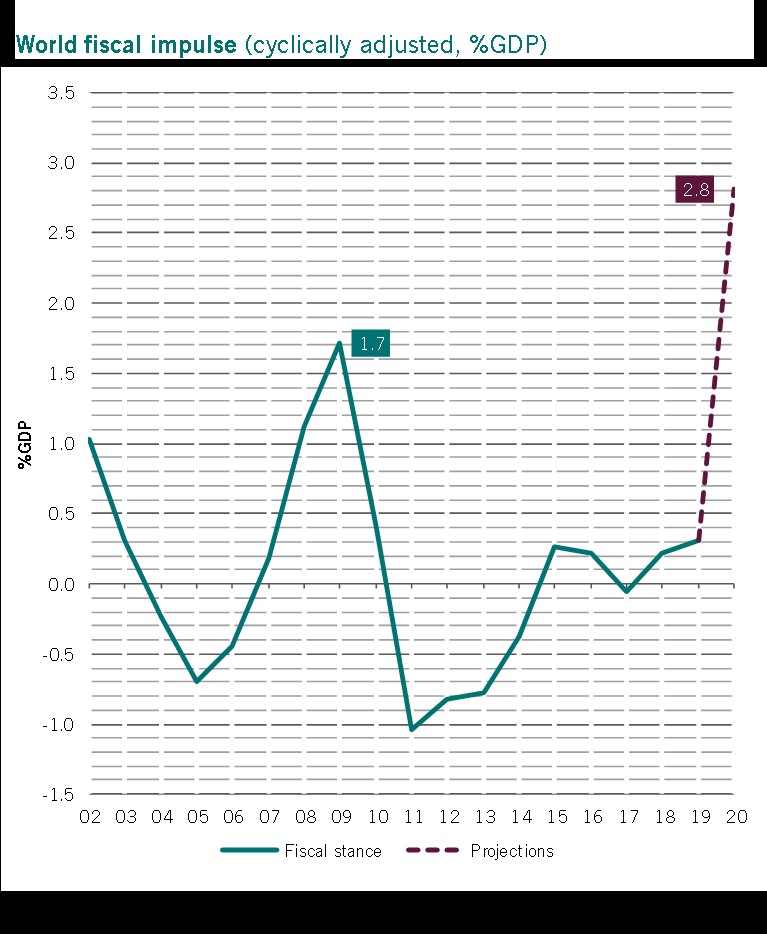
This recession has created a tidal wave of unemployment which has been met with a tidal wave of fiscal stimuli from global central banks and governments. As you can see from the chart below, the world fiscal impulse is 2.8% of the economy in 2020 which is above the peak in 2009 which was 1.7%. China, America, and Europe contributed about half of this stimulus (about 14% each). If this shutdown ends in the next few weeks, there might be a huge rebound in the 2nd half because of this stimulus. If the shutdown lasts a few months, there will be economic devastation even with all this help.
Conclusion
Hourly workers are in grave danger. We think if the shutdowns last into June, there will be an extension of jobless claims benefits. The unemployment rate might double in April and is on pace to hit 20%. This fiscal stimulus was almost twice as big as the one in 2009. Unfortunately, it won’t save the economy if the shutdowns last a few months. The stimulus is a life raft for the economy which has had a tidal wave of unemployment in the past week. The global fiscal impulse exploded in 2020 to meet the weakness caused by COVID-19.
Have comments? Join the conversation on Twitter.
Disclaimer: The content on this site is for general informational and entertainment purposes only and should not be construed as financial advice. You agree that any decision you make will be based upon an independent investigation by a certified professional. Please read full disclaimer and privacy policy before reading any of our content.


