UPFINA's Mission: The pursuit of truth in finance and economics to form an unbiased view of current events in order to understand human action, its causes and effects. Read about us and our mission here.
Reading Time: 5 minutes
We had enough evidence that the labor market was relatively fine after seeing the recent weekly initial jobless claims reports. Those who wanted further confirmation, received that in the March BLS report. There were 196,000 jobs created which beat estimates for 170,000 jobs created. The terrible February report was only revised up from 20,000 to 33,000. Some were expecting it to be revised much higher. However, it’s important to recognize large variances in this report are normal.
You can see in the chart below how there were a few very strong and very weak reports in the past 5 years.
At least the record streak of jobs being created was maintained. The yearly growth rate in non-farm payrolls didn’t improve much from last month which is a slight negative. However, it’s still higher than the 2017 trough.
Government Gains And Manufacturing Loses Jobs
After the February BLS report missed the ADP report by a mile, the March BLS report was actually better than the ADP one. Private sector job creation was 182,000 in March which was solidly better than the 129,000 gain reported by ADP. On the negative side, government job creation beat estimates soundly. The government was expected to have created 2,000 jobs, but as the chart below shows, it created 14,000 jobs. That made the private sector beat slightly less impressive than the overall beat.
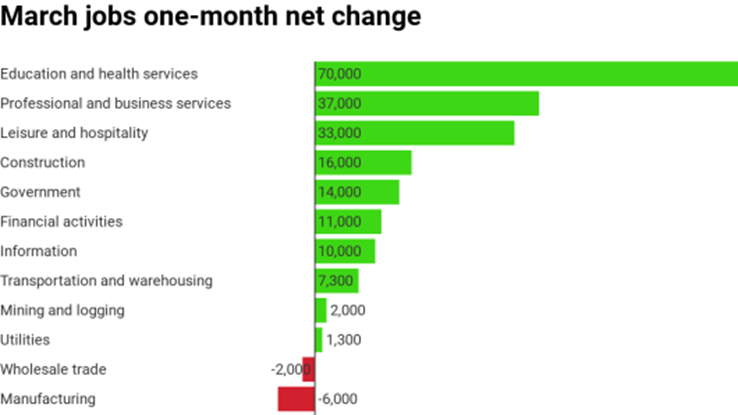
Manufacturing sector job creation has been weak in the past 2 months which supports the sequential decline in the Markit manufacturing PMI readings in February and March. There were 1,000 jobs created by manufacturing in February which was less than the 4,000 initially reported, even though the overall reading was revised higher. The chart above shows the sector lost 6,000 jobs in March which missed estimates by 16,000. The manufacturing sector is much more sensitive to changes in the economy than the education and health services segment which added 70,000 jobs.
The biggest contributor to job creation isn’t economically sensitive partially explaining why the BLS reading isn’t a leading indicator. The criticism of the BLS report for not leading the economy is unfair. Just because it doesn’t lead, doesn’t make it unimportant. The BLS reading is a product of inflows and outflows, while it’s hiring that gets cut first. That also makes it not a leading indicator. If you think of yourself as a manager, it’s easy to see why economic uncertainty would cause a slowdown in hiring and that it would take significant weakness to start firing workers.
Unemployment & Participation Rates
There’s not much to see with the unemployment rate and underemployment rate since they were both unchanged at 3.8% and 7.3%. The underemployment rate is at a cycle low and the unemployment rate is a tick above its cycle low. The labor participation rates are slightly more interesting. The overall participation rate fell from 63.2% to 63%. It had broken out to a new high in January and stayed there in February. This decline puts it back in its 5 year range. We follow the prime age participation rate the closest because it’s not affected by changes to demographics. It was unchanged at 82.5%. It has increased 0.5% in the past year. If the rate continues increasing at that speed, it will hit the previous cycle peak in 1.8 years. On this basis, the labor market is tightening but there is still slack left.
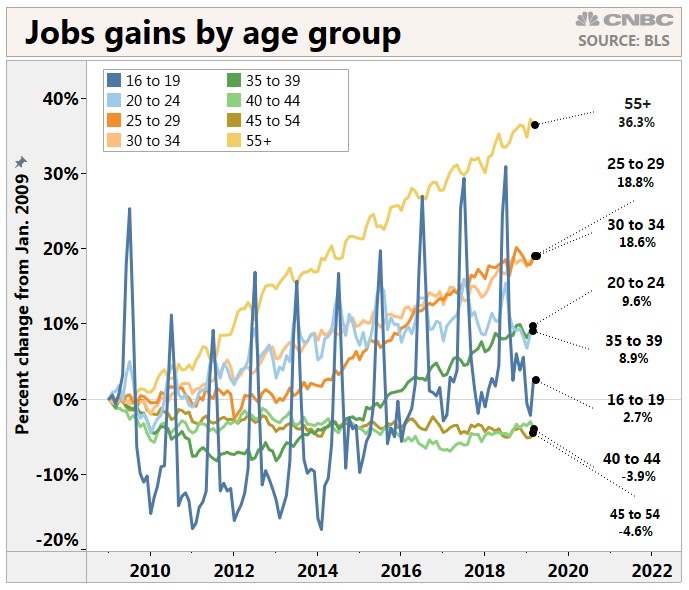
Job Gains By Older People
The overall participation rate is lower than recent cycles because the median age in America is increasing and because teenagers don’t work as much. The chart below shows the gains in jobs by age group since January 2009. Those 55 and older have seen gains of 36.3%.
Older people still work at a lower rate, but their rate has been increasing. People are living longer than prior expansions and jobs are less physically taxing. As you can see, jobs for 16 to 19 year olds only increased 2.7%. That’s because young people are focusing more on education. In March there was a rare drop of 209,000 jobs for those ages 55 and older, but that’s noise. Sometimes there are random huge swings.
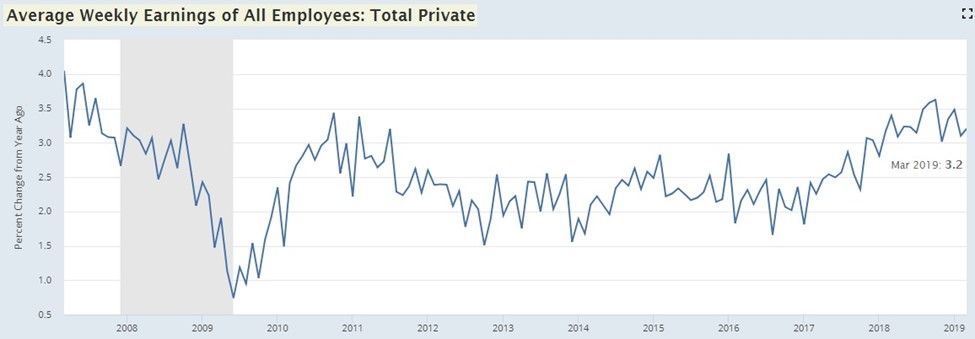
Weekly Wage Growth Improves
Yearly hourly wage growth fell from 3.4% to 3.2%, missing estimates for 3.4%. Many economists seem to be interpreting this as great news because it means the labor market is strong, but not strong enough to create excess inflation which is what generally occurs late during the economic cycle. Firstly, inflation hasn’t been rising with wage growth. Secondly, the main catalyst of this change was the work week length. Growth actually increased when you consider the increased work week. Hours worked per week went from 34.4 to 34.5 which met estimates. As you can see from the chart below, average weekly wage growth increased from 3.1% to 3.2%. It has been in a tight range since February 2018. We will highlight this reading when it breaks out of its range.
Increased Duration Of Unemployment
Since the jobless claims reading is partially broken because less people are filing for benefits, as we mentioned in our last article, let’s look at the duration of unemployment. As you can see from the chart below, the median year over year change in the duration of unemployment increased for the first time since July 2016. This was the biggest yearly increase since 2011.
Education Gap Remains Low
Lately, the labor market has been fantastic for workers who aren’t educated in schools. As you can see from the chart below, the difference between the unemployment rate for those without a high school diploma and those with a bachelor’s degree and higher has been below 4% since January 2018. It has never been this low for this long. That’s the benefit of a very long expansion.
Conclusion
Some are dubbing this the perfect jobs report because wage growth didn’t explode and job growth rebounded. It’s great to see job creation rebound. Wage growth hasn’t translated to inflation. Real wage growth helps the consumer, but pay raises hurt businesses’ margins especially those that are labor intensive. Those who are looking for a reason to sell stocks because the S&P 500 is up 15.39% year to date will need to look elsewhere. This was a solid report. It’s not a surprise that the February reading was a one off weak one. That happens all the time.
Have comments? Join the conversation on Twitter.
Disclaimer: The content on this site is for general informational and entertainment purposes only and should not be construed as financial advice. You agree that any decision you make will be based upon an independent investigation by a certified professional. Please read full disclaimer and privacy policy before reading any of our content.


