UPFINA's Mission: The pursuit of truth in finance and economics to form an unbiased view of current events in order to understand human action, its causes and effects. Read about us and our mission here.
Reading Time: 4 minutes
We have shown quiet a few comparisons of millennials’ net worth compared to baby boomers when they were at the same age. Millennials usually don’t come off looking like they’re in good financial shape. Millennials are buying houses and having kids later in life partially because they are saddled with student loan debt.
The latest Federal Reserve analysis surprisingly shows the median household net worth of millennials is the same as it was for baby boomers when they were in their mid to late 30s. One counterpoint to the notion that millennials are doing just as well as boomers is that they are having fewer kids which lowers their expenses considerably. If millennials are moving out at a later date and not adding dependents, it makes sense their net worth is as strong as boomers.
Keep in mind, this is as of 2019 which means it doesn’t include the massive labor displacement that occurred because of COVID-19. Young people who were laid off were more likely to work at a different job than older people. 26% of the people who lose their job ages 18-29 (gen z and millennials) were at a new job, while the percentage was 8% from those 50-64.
As of the end of last year, millennials benefited from a 10 year long bull market. They also didn’t own houses that fell in value like generation x did. To be clear, the financial crisis still hurt millennials’ earnings power. That effect from the COVID-19 crisis could be put on generation z, but it depends on how long this pandemic lasts. We can’t make long term projections at this point in its lifespan.
REIT Collections Increase
Rent is staring to be paid after a large dip in the percentage paying during the depths of the COVID-19 crisis. As you can see from the chart below, rent collections at industrial, apartments, and offices to REITs increased 2%-3% to the mid to high 90s this summer.
The real improvement was from retail as 91% of free-standing retail paid its rent which was up from 73% in April. As more stores opened up, more paid rent. Obviously, if the problem was deeper than just the closures, they went belly up. Usually, in recessions the worst firms go bust, while the rest survive. Any business that was in great financial shape and was doing well probably survived this crisis.
Retail shopping centers saw a 30% increase in rent payments to 80%. Malls have been hit hard by this crisis as America has too many of them. The c-rated malls are in deep trouble of closing. Even the b-rated malls were questioned during the worst of this crisis. As we mentioned in a previous article, retail mostly avoided bankruptcy because of the risk hungry debt market. Investors are leaping to the conclusion that physical retail and offices won’t be nearly as needed even after this crisis is over. That largely depends on how long we are forced to live cautiously.
The Pain The Recession Caused
The stock market is mostly ignoring the prospects of a stimulus besides small cap value stocks which are more affected by the economy. However, the stock market doesn’t tell the whole story of the crisis. As you can see from the graphic below, 33% of adults used money from savings or their retirement since the COVID-19 outbreak started. Obviously, there is a big difference between the two. Tax penalties on taking money from retirement accounts were lifted. However, that just kicks the can down the road because eventually people will need to retire. When you take money out and return it gradually, you lose all those years of compound gains. The worst case would be if someone took their money out in the spring when the market was much lower.
16% of people had trouble paying the mortgage or rent. It’s mostly rent as the people in the upper class, of which 3% had trouble, own homes. The people in the lower class, of which 32% has trouble, mostly rent. It’s key to focus on renters. If you focus on home owners that are mostly ok, you’re missing those hurt the most and creating fear for no reason. Policy makers already have issues to solve. There’s no benefit in making up new issues.
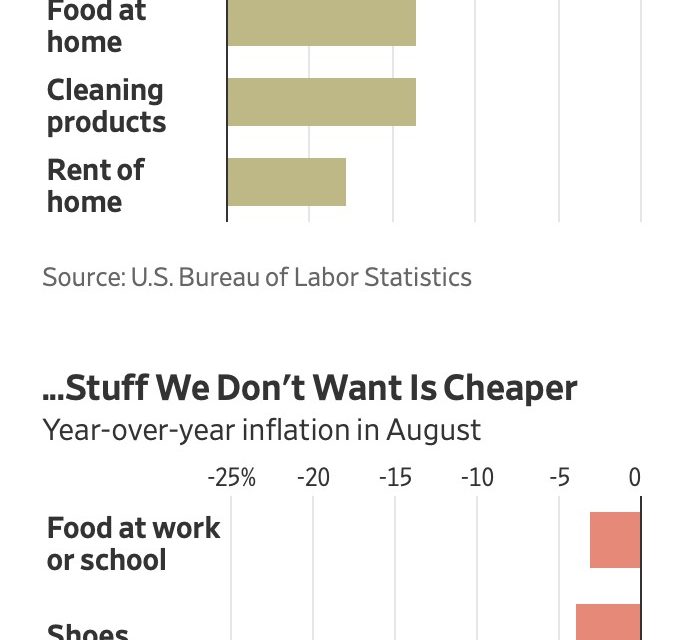
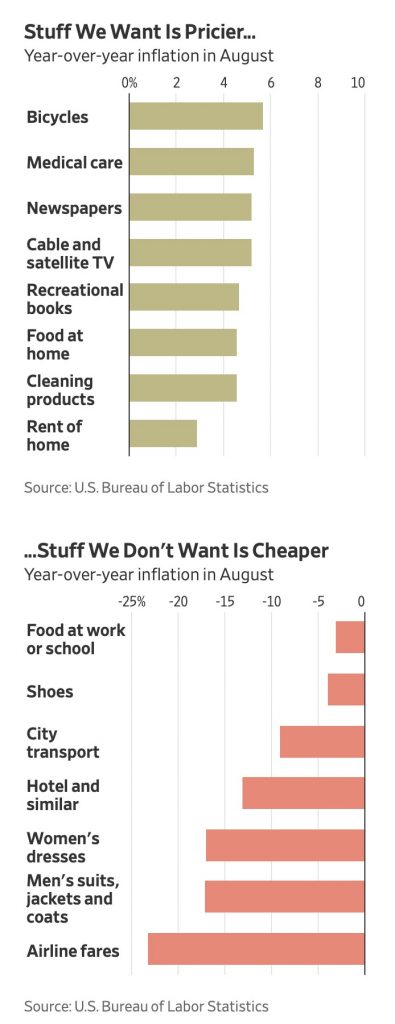
Inflation In The Stuff We Want
The Fed calculates inflation so that when prices go up, they assume you buy a substitute. That didn’t work in 2020 where demand shifted for a reason. As you can see in the charts below, inflation for bicycles, cleaning products, and medical care was high, while inflation for airline fares, food at work or school, and clothes was negative. People looking to go on vacation didn’t have the choice of taking a plane rather than a used car because of the pandemic. Therefore, inflation may have hit people harder than the CPI calculation indicates.
Equity Duration
We all know that value stocks will do better than the market when rates rise and growth stocks will underperform. The chart below shows the details behind that. As you can see, value stocks have the lowest implied duration, while growth has the highest. To be clear, higher duration means higher sensitivity to changes in rates. Defensive stocks probably have high duration because their dividend yield is priced versus treasury yields. Prior to the COVID-19 crisis, utilities were being bid up because of how low treasury yields were. Trades go in and out of fashion, so it’s not always this simple.
Conclusion
The Fed calculated that at the same age, millennials and boomers have/had the same net worth which probably shocks many people because there are always stories about how badly millennials are doing financially. Millennials are benefiting from not having children as young or at all in some cases. More retailers are paying rent compared to April. Low income renters were hit hard by the recession. Inflation occurred more in the items people bought due to the virus. Growth stocks are the most sensitive to a rise in interest rates.
Have comments? Join the conversation on Twitter.
Disclaimer: The content on this site is for general informational and entertainment purposes only and should not be construed as financial advice. You agree that any decision you make will be based upon an independent investigation by a certified professional. Please read full disclaimer and privacy policy before reading any of our content.


