UPFINA's Mission: The pursuit of truth in finance and economics to form an unbiased view of current events in order to understand human action, its causes and effects. Read about us and our mission here.
Reading Time: 4 minutes
Despite the recent fear of COVID-19 coming back, consumer spending is rebounding because of the stronger labor market. Estimates are for 900,000 jobs created in September with the unemployment rate falling to 8.2%. That explains why consumer confidence is also increasing as we will get to later in this article. In the week of September 26th, RedBook same store sales growth increased from 1.5% to 2.2%. That’s still weak, but it’s a step in the right direction.
This doesn’t mean COVID-19 isn’t a risk. If cases increase to the point where there are more shutdowns, the labor market will weaken and the consumer will spend less. The window for COVID-19 to hurt the economy is dwindling as we get closer to Abbott’s rapid testing devices being distributed to the states. People will take the test and then use a mobile app to prove they don’t have the virus, allowing them to fly on planes or go to gatherings.
Fiscal Stimulus Details Emerge
A fiscal stimulus could boost consumer spending further which would strongly ward off the possibility of a double dip recession. House Democrats unveiled their $2.2 trillion fiscal stimulus package which it could pass this week. The Senate will be more motivated to pass something if the stock market falls or if Trump’s poll numbers weaken. The package includes another round of $1,200 checks. These checks are set to go out to more people than the last round. $500 will go to adult dependents and full-time students younger than 24. The plan also adds $600 in weekly unemployment benefits through January.
The GOP’s biggest quibble will likely be with the unemployment benefits. The White House’s spending limit is $1.5 trillion which means the two sides are $700 billion apart. The next step in this negotiating process is for the White House to give its best offer. It’s extremely tough politically to go against checks to people while the unemployment rate is still high.
Consumer Confidence With A Big Surprise
Even though the Bloomberg consumer comfort index and the University of Michigan consumer sentiment index were strong in September, economists were still flummoxed by the sharp increase in the Conference Board consumer confidence index. It was 101.8 which beat the consensus which was 90. That is the biggest beat since November 2011. Economists must have been focused on the decline in jobless benefits and the increase in COVID-19 cases. Consumers were focused on the better labor market and improved business conditions. The headline index increased from 86.3 which made this the biggest spike since April 2003.
The expectations index rose from 86.6 to 104 and the present situation index rose from 85.8 to 98.5. The cutoff date for the survey was September 18th. That means for much of the survey period stocks were falling, but consumers ignored the noise. Some Democrats are more optimistic about the potential for Trump to lose judging by what we saw in the University of Michigan survey, but the strength in the present index shows the economy truly is getting better. The net percentage claiming current business conditions are good rose from -27.3% to -19.1%.
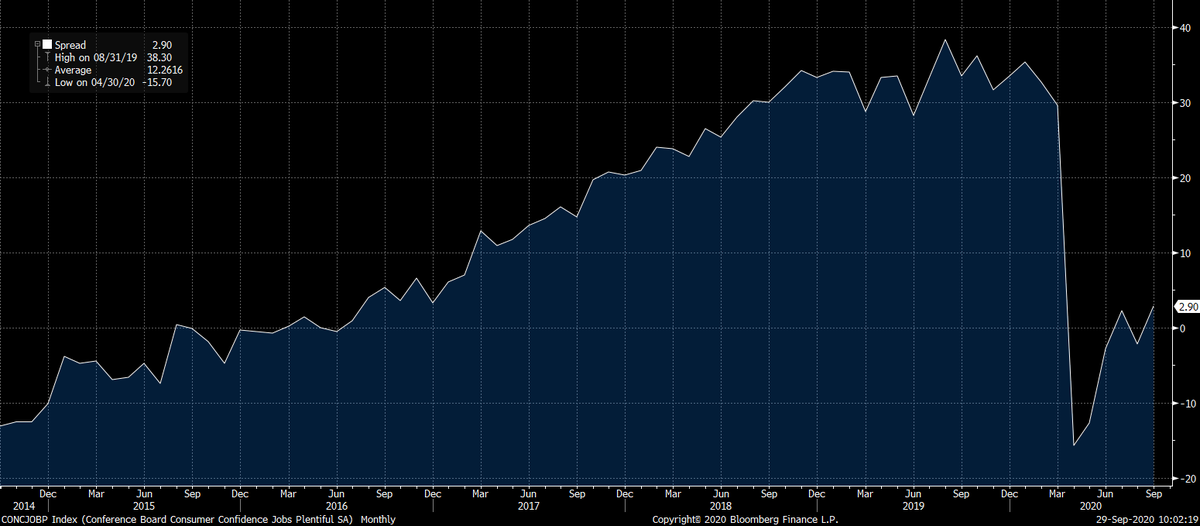
There was an even bigger increase in the net percentage of consumers expecting business conditions to improve in the next 6 months as it rose from 9.1% to 21.3%. On the labor market, 22.9% of consumers said jobs are plentiful and 20% said jobs are hard to get. The differential is shown in the chart above. 33.1% of consumers expect more jobs in the months ahead and 15.6% expect fewer jobs. The only way you can expect fewer jobs is if you think another wave of COVID-19 is coming and that the tests do nothing to allow the economy to operate fully with the virus still brewing.
Not A Disaster For Cities
It generates a lot of clicks to say cities are dying because so many people have strong opinions on them. It’s like a team sport where one side supports cities and the other supports rural areas or the suburbs. Unlike in team sports, in this case both can win. The death of cities is greatly exaggerated. Some of the largest cities like New York are in trouble, but there isn’t a mass exodus out of all cities.
As you can see from the chart below, since December 2019, urban home price growth is actually higher than that of rural. It trails suburban growth by a few tenths of a point. With the way some are talking about the death of cities, you’d think prices were falling dramatically. Fear sells. It’s unnecessary to make up any more negatives than have already happened this year.
July Case Shiller
As expected, home price growth was strong in July according to the Case Shiller report. The 20 city unadjusted price growth rate rose from 3.5% to 3.9% which beat estimates by 2 tenths. The national monthly seasonally adjusted annualized growth rate was 9.1% according to Bespoke Investment Group which is the highest since September 2013. The table below shows the growth rates in the 20 biggest cities. It’s no surprise New York City only had 1.4% growth because it was hit the hardest by COVID-19. That’s down from the peak of 2% in April. On the other hand, since March price growth in Phoenix increased from 8.1% to 9.2%. Growth improved in June and July even though Arizona was one of the worst hotspots at the time.
Conclusion
The consumer is doing very well as confidence increased sharply in September despite the decline in stocks. Consumers became more optimistic on the labor market and on business conditions. Spending growth increased a bit in the last week of September. Cities aren’t dying, although, New York City is in very rough shape. Some people think New York City is the center of the universe and nothing else matters. They might be shocked to see Phoenix had 9.2% home price growth. This is only from July. We saw in a previous report that home price growth increased further in August as the housing market is being supported by low rates, demographics, and high household net worth.
Have comments? Join the conversation on Twitter.
Disclaimer: The content on this site is for general informational and entertainment purposes only and should not be construed as financial advice. You agree that any decision you make will be based upon an independent investigation by a certified professional. Please read full disclaimer and privacy policy before reading any of our content.


