UPFINA's Mission: The pursuit of truth in finance and economics to form an unbiased view of current events in order to understand human action, its causes and effects. Read about us and our mission here.
Reading Time: 4 minutes
The economy likely had solid job growth in September, albeit it will be much lower than August. It’s good job creation given the circumstances. Specifically, the leisure and hospitality industry is hamstrung by the COVID-19 restrictions. Airplane travel is still down by about 2/3rds. We need better treatments or a vaccine to show promise along with testing at airports. The travel industry can recover next year if everything goes right. The good news is the 7 day average of testing has reached 883,087 which is near its record high. The testing data is headed in the right direction, but more work needs to be done.
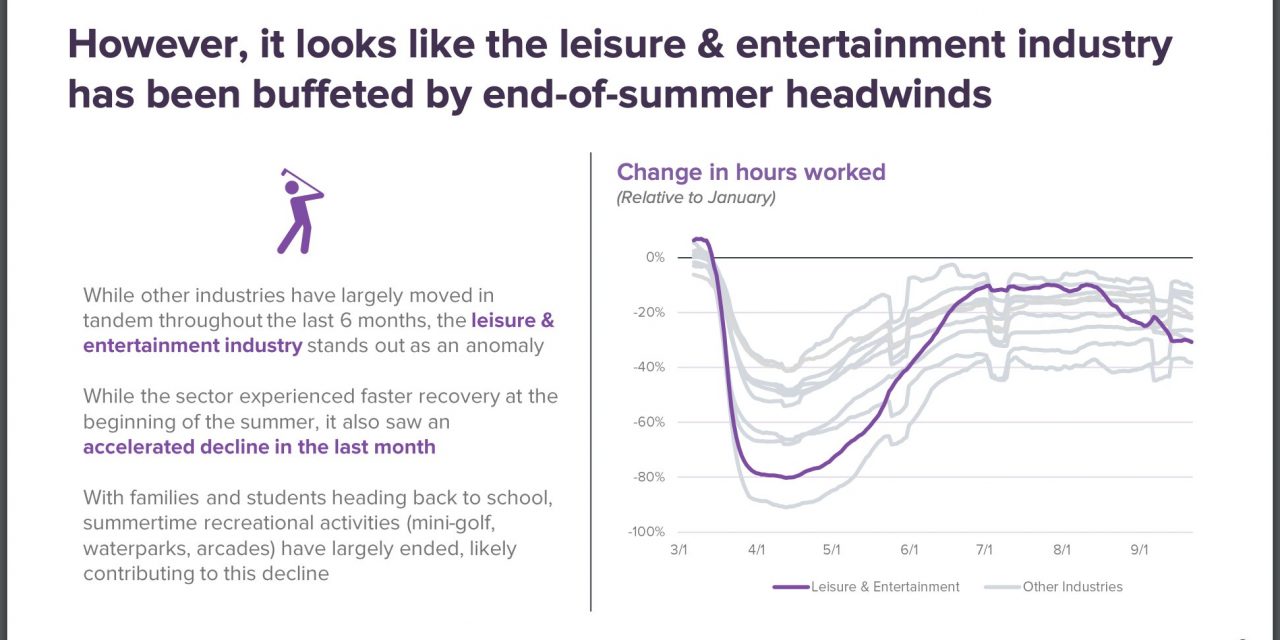
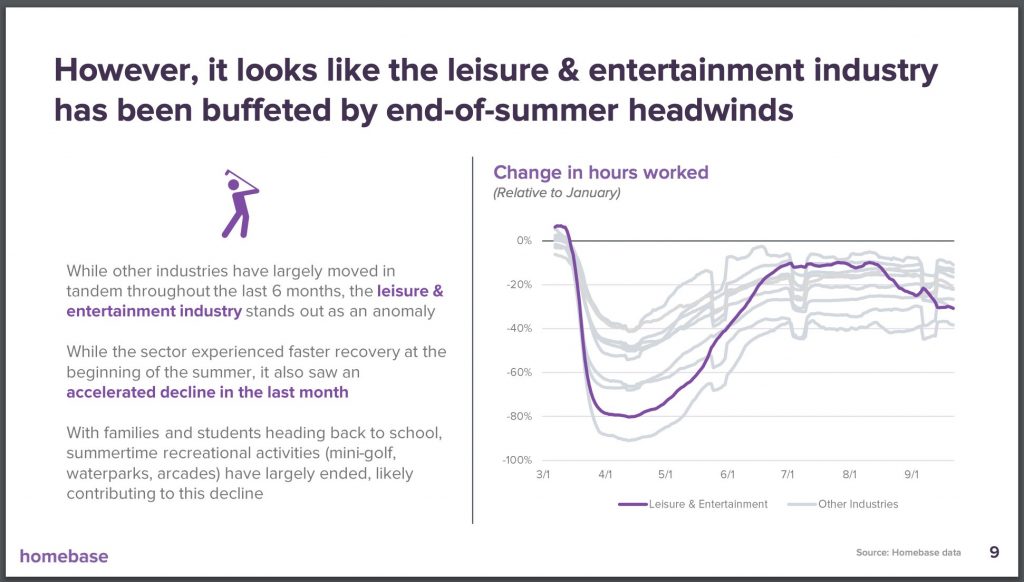
According to homebase, the leisure and entertainment industry had an abnormally large decline in hours worked at the end of the summer. That’s likely because summer activities ended. Within this industry we even had an uneven recovery. If outdoor activities were holding the industry up, it’s headed for a world of hurt before rapid testing, vaccines, and treatments get the economy back to normal.
As you can see from the chart above, there was modest weakness in employees working in September which was less weakness than usual. Specifically, there was a 25% decline in employees working from January to September. That’s 4 points worse than August. However, part of the sample period was during Labor Day weekend. That holiday has sharply altered a lot of non-seasonally adjusted data. We look forward to a better representation of reality on how the labor market did when the BLS report comes out on Friday. The consensus calls for 850,000 jobs created. Keep in mind after the ADP report comes out on Wednesday that it has been below the BLS report each month since the recovery started, but the error rate has been falling. Therefore, if it disappoints, it might be more worrisome than recent months, but not a disaster.
Review Of August Durable Goods Orders Report
Headline August durable goods orders missed estimates, but core capital goods orders beat them. Specifically, monthly new order growth fell from 11.7% to 0.4% which missed estimates for 1.5%. That being said, the revision was 0.5% higher. Core capital goods orders beat estimates and had a higher July revision. Growth fell from 2.5% to 1.8% which beat estimates by a tenth. The revision was up from 1.9%.
The table above shows the much-discussed K-shaped recovery. If you look at the letter ‘K’, each of its arms go in opposite direction which is how the economy did. The transportation industry is the bottom arm as its orders are still down 15.7% from February. On the other hand, computers and electronics orders are up 4.1% from February. Normally, investors exclude aircraft orders to get a true understanding of the economy because those orders are volatile. This time, we will be focused on aircraft orders because they are a key signal of when the bottom arm of the K shaped recovery starts to revert to normalcy like the rest of the economy.
Massive Housing Boom
We’ve been saying this is the strongest housing market since the last bubble in the 2000s. The data is truly bearing that out. As you can see from the chart below, there were 1.011 million new home sales in August which was the highest for a month since late 2006 which was the end of the housing bubble. The single-family housing market is strong because of low rates, people moving from cities to single family homes in the suburbs, and high household net worth.
The people who can afford to buy a house make more money which means they are working from home (higher income = more likely to work from home in the pandemic). They can afford to move to the suburbs because they can keep the same job and work at home. The new trend after COVID-19 is over will be hybrid working where people will come into the office sometimes. It’s not as bad to live further from work if you only need to come in a couple times per week.
The housing market differed drastically by region. Remember, most new sales are always in the west and the south. It wouldn’t matter much to the overall reading if the northeast varied drastically from the rest of the country. Monthly growth was 13.4% in the south which is why the overall reading was strong. Growth was 5% in the northeast and -21.4% in the Midwest. Growth was -1.7% in the west. The weakness in the west was likely due to the wildfires. 6,900 structures were destroyed since August 15th. Obviously, many building projects were delayed by this event. As you can see from the chart below, there are only 3.3 months of new home inventory left which is a record low. That makes sense because we had such a quick boom. Construction couldn’t catch up.
Retail Bankruptcies Still Low
Given the massive shift in sales from brick and mortar stores to online sales, one would expect there to be a lot of retail bankruptcies. However, there have been very few bankruptcies in 2020 for a recessionary year. As the chart below shows, there were only 44 bankruptcies through August 13th. That’s around the same as there have been since 2010. It’s about 1/10th of the bankruptcies in 2008. That’s because this has been the best year for retail debt issuance ever.
On a related note, there have been $329.8 billion in junk bonds issued in 2020. That set a new record as of September 23rd as it passed the 2012 record. We still have a few months left in the year to extend the record. We have extreme risk taking, firms (like in retail) that need to issue debt, a supportive Fed, and low interest rates. It’s the best time ever to issue junk debt.
Conclusion
Job creation (technically people getting their old jobs back) was solid in September as we will see in Friday’s report. It’s strong when you consider how hampered the leisure and hospitality industry still is. The durable goods orders report was solid. Transportation is still in trouble as it is the bottom part of the K-shaped recovery. This is the hottest housing market since the 2000s bubble. Even though this has been a terrible year for physical retail, the debt market bailed out retailers which is why there were so few retail bankruptcies. Junk debt issuance hit a record high in 2020 with time to spare.
Have comments? Join the conversation on Twitter.
Disclaimer: The content on this site is for general informational and entertainment purposes only and should not be construed as financial advice. You agree that any decision you make will be based upon an independent investigation by a certified professional. Please read full disclaimer and privacy policy before reading any of our content.


