UPFINA's Mission: The pursuit of truth in finance and economics to form an unbiased view of current events in order to understand human action, its causes and effects. Read about us and our mission here.
Reading Time: 5 minutes
In the financial media, it’s easy to see what the economists and analysts think about the current economy because usually they propose more of the same when asked about the future. It’s simple to extend the current trend indefinitely, but that’s not always a good idea, nor is it realistic. Even during economic expansions, there are mid-cycle slowdowns. While a slowdown doesn’t mean a bear market is coming for the overall market, it could mean a correction is coming in at least a few sectors. Therefore, it should affect how you allocate capital.
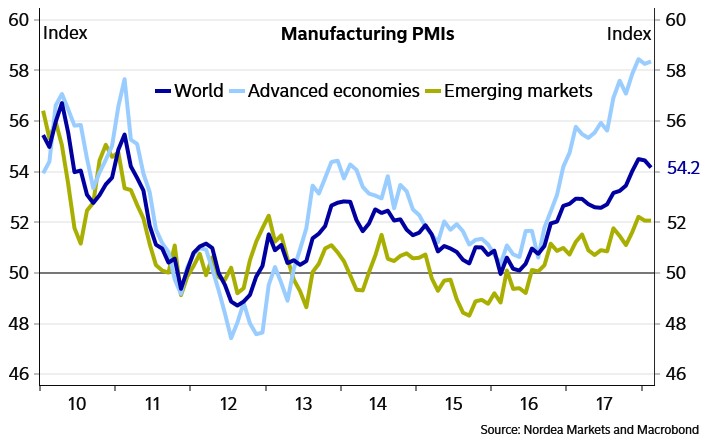
The chart below shows the cyclicality of the manufacturing industry.
Manufacturing and emerging markets had weakness in 2012 and 2016. There have been several phase changes, so it would be wrong to ever assume the current situation would continue for the next few years. Currently, the U.S. manufacturing ISM PMI is at the highest point since May 2004. It’s easy to get excited by this, but stocks will trade on future results not past reports. There probably needs to be a recession to justify a bear market, but there are still a lot of other situations to choose from after you rule that out.
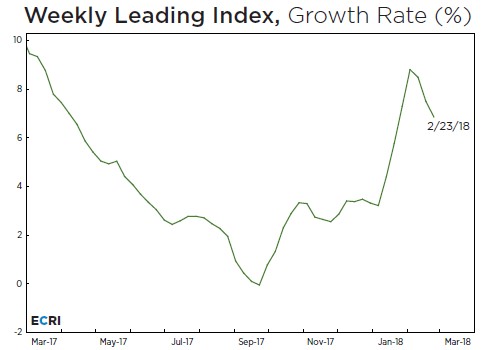
ECRI Says Weakness Could Be Coming
The ECRI leading index suggests there could a slowdown in the first half of 2018 despite the fiscal stimulus. The stimulative measures are the tax cut and the $400 billion spending program over the next 2 years. One thing to keep in mind is the first quarter was mired by the risk of a government shutdown, so it may take until Q2 to see the positive effects from the government spending. The other thing to follow is that the bump up in growth caused by the rebuilding after the hurricanes is mainly gone.
The ECRI index suggests weakness in the first half of 2018 and then strength in the second half of 2018. To give context on the success of this indicator, in March 2009 the ECRI outlook said “Such upticks on leading index growth have always been followed by a growth rate cycle upturn.” The weakness in the past few weeks could signal economic weakness in early 2019, but it’s too early to tell if the weakness will be prolonged. For the immediate term, it’s certainly easy to see manufacturing slowing down.
JP Morgan Global Manufacturing Forecast
The best time to buy stocks is when the consensus is so negative, that positive catalysts are ignored. We’re in the opposite scenario in the winter of 2018 as the narrative of a global synchronized recovery has been the consensus for 6 months. The forecast for the least amount of countries being in a recession ever in 2018 is probably a sign of peak bullishness. The great returns in the S&P 500 during 2017 were the result of pricing in the tax cut and the narrative shifting from a decelerating economy, which occurred in 2016, to the accelerating one of 2017. It could be dangerous if the central banks hike rates and taper QE on the back of the 2017 economic strength and 2018 fiscal stimulus because the economy grow sustainably with those negative catalysts.
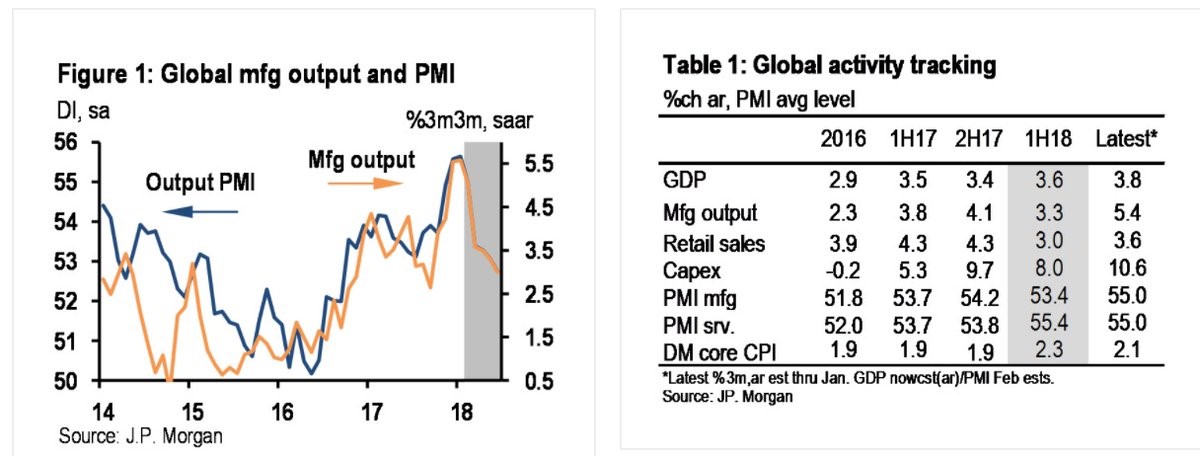
The chart on the left shows the global manufacturing output and PMI are forecasted to decline on a quarter over quarter basis.
The table on the right shows many of the key global indicators are expected to weaken from the 2nd half of 2017 to the first half of 2018. Specifically, the manufacturing output, retail sales, capex, and manufacturing PMI are expected to decelerate. What’s even more ominous is the latest forecasts, which take in some of the reports and estimates from early 2018, are much more optimistic than the 1st half estimates, implying a slowdown in Q2. Global manufacturing in the first 2 months is expected to grow 5.4%, but it’s only expected to grow 3.3% in the first half.
Bear Market Signposts
So far, in this post we’ve reviewed the potential for a slowdown in Q2 which could impact the way you allocate your investments. Furthermore, it’s important to note the tax cuts are now fully in the S&P 500 earnings estimates for 2018. However, that doesn’t mean earnings will grow 18% as expected. The estimates usually fall throughout the year, which means 18% might be the peak in estimates if the trend holds. It’s especially likely to hold if there’s any economic weakness. Now let’s move on to the longer term to predict when risks could increase for the next bear market to occur.
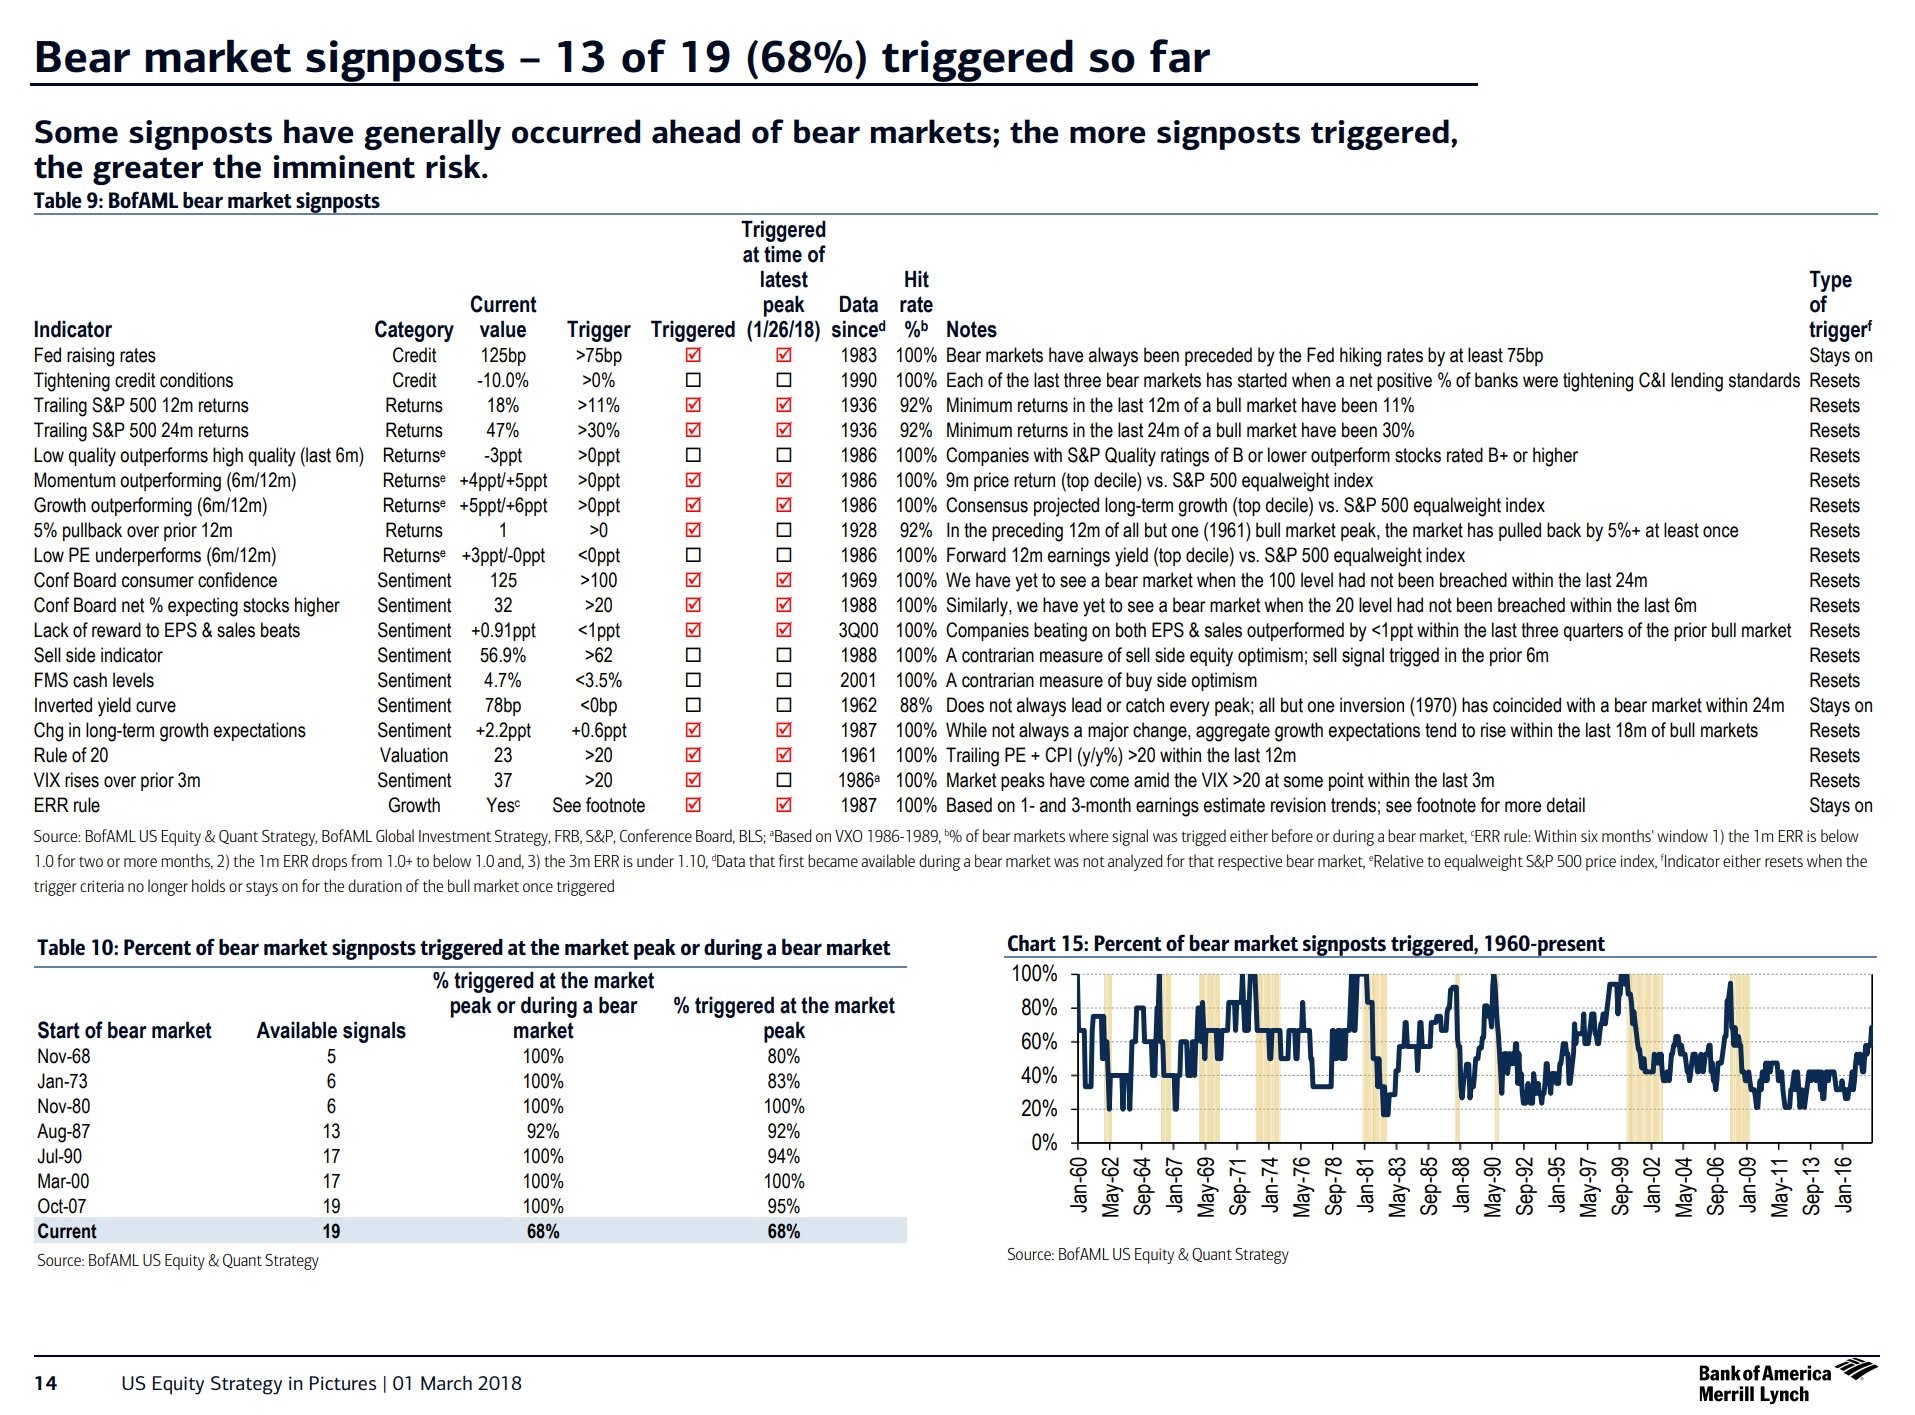
The list below reviews 19 potential signposts of a bear market.
68% of the indicators for a bear market have been triggered. This shouldn’t scare you for 2018 because the lowest percentage of indicators triggered at the peak before a bear market is 80% in November 1968. That implies the January peak wasn’t the final one for this bull market. Furthermore, the recent volatility in stocks will hurt sentiment which means it’s less likely stocks will decline significantly. The number of bullish investors has fallen by about 15% since the peak in the Investors’ Intelligence poll. Going from extreme euphoria to relatively normal bullishness is why corrections are considered ‘healthy.’ Corrections prevents investors from investing all their money in stocks because they are scary. If all investors went all in, the market would tank soon afterwards because there would no longer be any buyers left.
The signposts we look at don’t signal a bear market in the next 12 months. The 10 year treasury yield minus the 2 year yield is at 62 basis points. It still needs to fall to negative territory and then start to increase again before a recession. The employment to population ratio for ages 25-54 is at 79% which implies the labor market isn’t full enough to inspire a sharp increase in the Fed funds rate which would cause a recession. As of early March 2018, the Fed is about halfway through its hike cycle.
Conclusion
There might be some cyclical weakness coming, particularly in manufacturing, but there aren’t enough bear market signposts to signal a major decline from the recent peak in stocks in late January. Furthermore, the employment to population ratio implies the labor market isn’t at full employment. This is a better way to review the labor market than the unemployment rate and jobless claims because it both adjusts for changes in the demographics and for the people who gave up looking for work following the 2008 financial crisis. All those workers need to come back into the labor force before wage growth accelerates. The yield curve backs this forecast as it hasn’t inverted yet.
Have comments? Join the conversation on Twitter.
Disclaimer: The content on this site is for general informational and entertainment purposes only and should not be construed as financial advice. You agree that any decision you make will be based upon an independent investigation by a certified professional. Please read full disclaimer and privacy policy before reading any of our content.


