UPFINA's Mission: The pursuit of truth in finance and economics to form an unbiased view of current events in order to understand human action, its causes and effects. Read about us and our mission here.
Reading Time: 5 minutes
The June PPI-FD inflation report showed mixed results. Energy inflation was very weak and trade services inflation was strong. That’s reflected in each breakdown of the PPI report. Headline PPI was 1.7% which met estimates and was down 0.1% from May. Core PPI was 2.3% which beat estimates for 2.2% and was the same as May. Finally, core PPI without trade services was 2.1% which missed estimates and May’s reading of 2.3%.
Energy prices fell 3.1% monthly. Finished goods, computers, and government purchases fell 0.4%, 0.8%, and 0.4%. There was positive monthly inflation in food and total services as they were 0.6% and 0.4%. Trade services inflation was 1.3% monthly, explaining why core inflation was higher than core inflation without trade services. That’s a reversal from the prior 2 months. Finally, core personal consumption was 0.5% which means core PCE will increase.
The entire point of reviewing the PPI report is to determine where core PCE will be when it’s released on July 30th. Each tenth of a percent wouldn’t matter if the Fed wasn’t using core PCE inflation to set interest rates. If core PCE inflation was 1% higher, in theory the Fed would be much more hawkish, changing the direction of asset prices. Lately, though it seems like the Fed is trying to extend the business cycle rather than worry about inflation and unemployment. Maybe that’s the right focus because core inflation has been stable this cycle and the labor market has been strong for a few quarters. Maybe the Fed should look to other economic indicators to see if weakness is coming.
Either way, the chart above shows based on the data from the CPI and PPI reports, core PCE will be 1.66% in June. That’s not a problem because it’s below 2%. However, it’s notable that the moment the Fed gave up on low inflation being transitory, it perked up a bit. On the tight labor market potentially leading to inflation, Powell stated, “We don’t have any basis or any evidence for calling this a hot labor market. 3.7% is a low unemployment rate, but to call something hot, you need to see some heat.”
The Inflation Adjusted PE Multiple Is Average
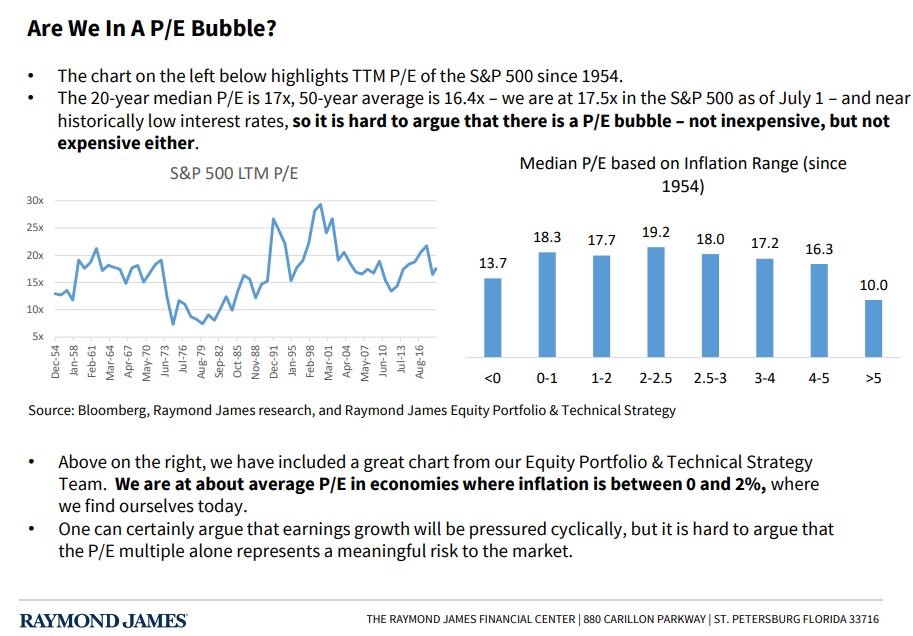
The S&P 500 is up over 20% year to date, but stocks aren’t extremely expensive because they were very cheap at the start of the year. The timing of the calendar year, just happened to be very close to the bottom in stocks. December is usually a very good month for stocks, but not in 2018. As you can see from the slide below, the S&P 500’s trailing PE multiple was 17.5 as of the start of Q3 which is 0.9 above the 50 year median.
Stocks are just a little bit more expensive than usual. As you can see from the chart on the right, median PE multiples are higher when inflation is lower unless it’s below 0%. The PE multiple is 0.2 below the median when inflation is between 1% and 2% like it is now. It’s nice to know that stocks aren’t heavily relying on low positive inflation because obviously that could be a big problem if inflation rises or falls.
Earnings Matter As Always
Only people who don’t understand the fundamentals say earnings don’t matter. You see people responding to one data point that’s negative while stocks rally saying the fundamentals don’t matter. Monetary policy allows for easy financial conditions and inflation to be low, but if earnings don’t grow, stock prices won’t go up in the long run. As you can see from the charts below, earnings have tracked both the performance of the S&P 500 and the Europe 600 index.
FactSet Earnings Results
Q2 earnings season won’t be a disaster. Growth will be slow because of tough comps and the weak global economy, but there’s nothing to fear. Q2 EPS growth was expected to be -2.7% at the end of Q2 which is actually higher than Q1 estimates ended Q1 at. Q1 ended at -4% and the final result was -0.3%. That’s not exactly an earnings recession that will crash stocks. Q2 EPS growth will probably be positive. If results beat by the average amount, growth will be 1%. The latest update is -3% growth with 24 firms reporting. The estimate cuts in Q2 were 2.6% which is less than the 5 year, 10 year, and 15 year averages of 3.3%, 3.1%, and 4.2%.
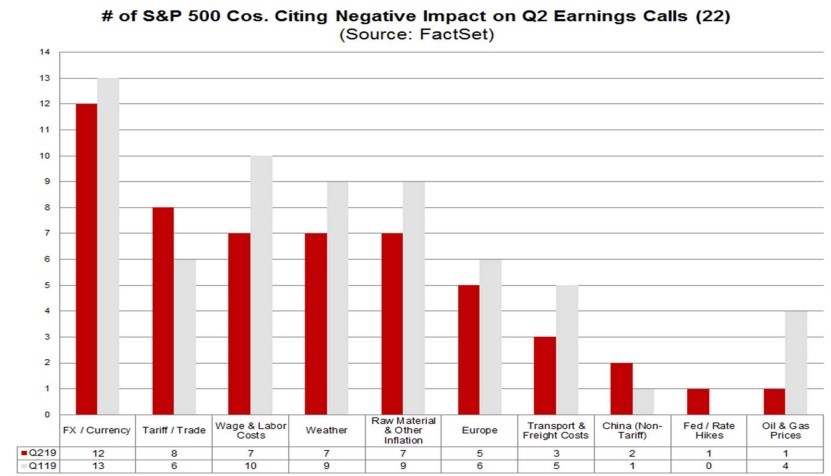
The chart below shows the negative impacts mentioned on the first 22 S&P 500 Q2 earnings calls.
As you can see, trade is a bigger issue in Q2 than Q1 as 8 firms mentioned it instead of 6. That makes sense because new tariffs were implemented in the quarter. Wage and labor costs were mentioned by 7 firms instead of by 10 firms in Q1. That matches the decline in average hourly earnings growth.
Don’t Fear Records
It’s fine to be bearish because stocks are overbought. After all, 83.37% of S&P 500 stocks are above their 50 day moving average. Stocks are hot. However, don’t be scared off by record highs. It’s common for contrarians to get negative when stocks are at a record. Being at a record is normal. You need to look at valuations to determine if stocks are expensive and the economic cycle to determine if the economy is weakening.
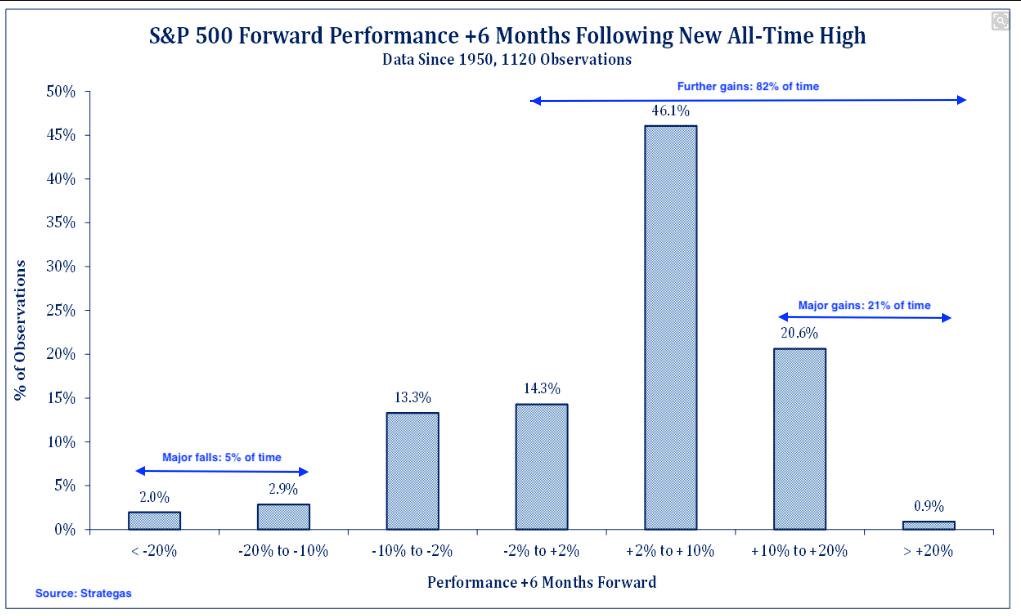
Not only is the S&P 500 being at a record high not a good enough reason to be bearish, stocks actually do really well following records. As you can see from the chart below, the S&P 500 follows records with gains in the next 6 months 82% of the time.
The gains are 10% or higher 21% of the time. Losses of 10% or more occur just 5% of the time.
Conclusion
Core PCE inflation will be about 1.7% in June. It almost never is far off from estimates because it comes out so late. By the time it comes out, we’ve seen the CPI and PPI reports, so it’s difficult for PCE inflation to be different from estimates. Earnings matter. The trailing S&P 500 PE multiple is slightly above the long run median. Q2 EPS growth is set to be 1% which is far from a disaster. Stocks being at their record high isn’t a bad thing for future returns; it’s actually a good thing.
Have comments? Join the conversation on Twitter.
Disclaimer: The content on this site is for general informational and entertainment purposes only and should not be construed as financial advice. You agree that any decision you make will be based upon an independent investigation by a certified professional. Please read full disclaimer and privacy policy before reading any of our content.


