UPFINA's Mission: The pursuit of truth in finance and economics to form an unbiased view of current events in order to understand human action, its causes and effects. Read about us and our mission here.
Reading Time: 4 minutes
We have been reporting on the weak jobless claims readings for 6 weeks now. This latest report ended the record long 15 week decline in seasonally adjusted initial claims. With the revision from 1.3 million to 1.307 million, last week’s seasonally adjusted decline was only 3,000. The streak ending isn’t a big deal. Last week, the trend of unadjusted claims falling ended. This time it was the reverse as adjusted claims fell.
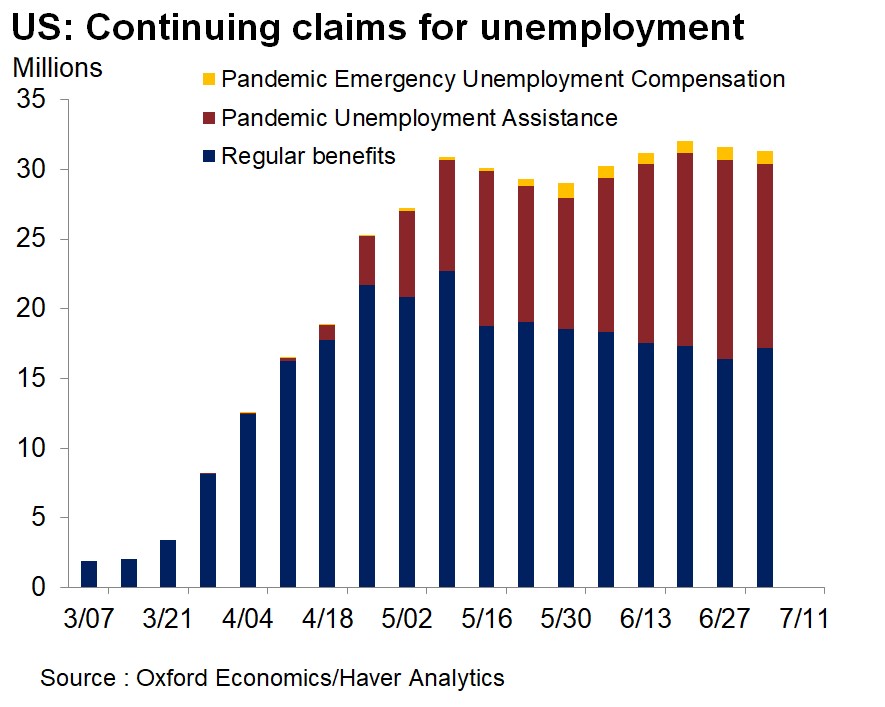
The key issue is how tough it is to get people their jobs back as the number of permanently unemployed people starts to pile up. The $600 in extra weekly federal benefits ends on the 25th. There is a possibility the government extends that to $100 per week (or more) for the rest of the year. It’s notable that the decline in non-seasonally adjusted claims plus PUAs basically ended in the 2nd week in June (fell 1%) as the chart above shows.
The scary aspect is that the slowdown in the labor market occurred before the restrictions were increased due to the spike in COVID-19 cases staring in late June. This could mean when the economy fully reopens, there might not be a flood of people getting their jobs back. To be clear, COVID-19 is a huge inhibitor to job creation. If it were to go away completely, jobs would be added quickly. However, if the situation gets back to the way it was in early June (contained but still in existence) before this spike, there may not be a huge decline in claims. That’s the negative case to consider.
Specifics Of The Report
Seasonally adjusted initial claims rose for the first time since March 28th. They were up from 1.307 million to 1.416 million. The 15 week decline that ended was by far the longest streak ever. This isn’t a random one off increase though. It had been coming for a while as the labor market has been stuck for about 6 weeks. This increase is important because it is the survey week of the July BLS report. This weakness further cements our expectation for job losses in July. It’s entirely possible that Congress isn’t aware this negative headline is coming. Maybe it would be better if nothing is passed until the data is given to government officials. After they see it, they will probably want to do as much stimulus as possible. They seem to be beating around the bush currently.
Continued claims in the week of July 11th fell from 17.304 million to 16.197 million. That’s not a bad result as that was the biggest decline since May 16th. PUA claims were up 19,000 to 2.35 million. Initial plus PUAs fell 5% on a non-seasonally adjusted basis. That’s the biggest decline in 6 weeks. As you can see from the chart above, overall continued claims have been shifting from those getting regular benefits to those getting PUA. Including pandemic unemployment compensation as well makes it look like the labor market hasn’t improved since early May. If that’s the case, it’s going to really tough to get the economy back on track. This chart looks depressionary.
Personal Finances Change
Expectations for personal finances in the next year have been volatile as the chart on the left shows. These expectations have been impacted by stimulus and COVID-19 cases. It’s likely that the final July sentiment reading is also weak since states didn’t reopen in the 2nd half of the month. The 7 day moving average of cases looks to have peaked which implies that the restrictions could ease in the coming weeks/months. More people are wearing masks and being careful in the hotspots.
The chart on the right shows the relationship between the savings rate and expectations for personal finances. Obviously, the duel axis is troubling. However, it’s basic logic that if consumers aren’t confident about the future, they will save more money. Many consumers probably saved more in July because they knew the $600 in weekly benefits was about to end.
Tax Hikes Could Be Coming
According to PredictIt, there is a 62% chance Joe Biden becomes president. This election is far from over. Trump’s approval rating fell a few points in the past few weeks. There’s no telling what it will do prior to the election. However, investors should always be weary of risk, so we are discussing the potential for a tax hike. The Democrats will likely try to pass one if they win. According to our Twitter poll of 82 investors, 85.4% said a tax hike isn’t priced into the U.S. stock market. They said that probably because the stock market has rallied sharply in the past couple months.
This represents a key risk for markets because unlike COVID-19, which had a major effect in 2020 and might have modest effects in 2021 and beyond, this tax hike will have the same negative effect every year until the law is changed. As you can see from the chart above, the $20 decline in S&P 500 EPS means the stock market currently trades at a very high forward PE ratio of 21.6.
Investment Managers Are All In
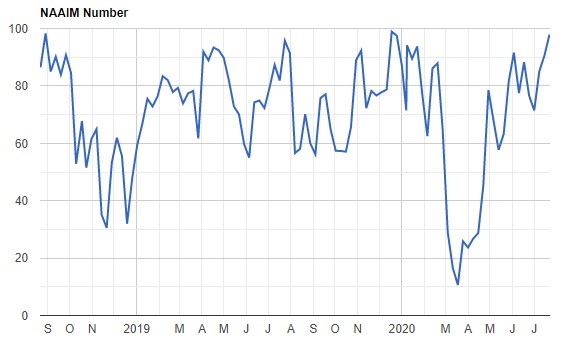
It’s not just retail investors who are euphoric. The NAAIM exposure index shows fund managers are almost as bullish as possible. The index rose to 97.58 from 90.53 which is the highest reading since December 18th, 2019. Even the fund managers in the first quartile had 75.75 positive exposure. They were almost fully invested. It’s highly probable these managers are all in on the big internet names since those are the ones that have done well up until recently. This reading is a hugely negative signal for stocks. It’s good to fade the optimism and pessimism when it gets extreme.

Conclusion
The labor market is in terrible shape. According to one stat, it hasn’t improved since early May. A weak July BLS report is coming. It should show net job losses. The stock market faces higher taxes which makes it look expensive. The NAAIM exposure index shows managers are extremely overweight stocks. This is a major sell signal. It doesn’t mean stocks will fall right away, but a correction could be coming in the intermediate term (next few weeks).
Have comments? Join the conversation on Twitter.
Disclaimer: The content on this site is for general informational and entertainment purposes only and should not be construed as financial advice. You agree that any decision you make will be based upon an independent investigation by a certified professional. Please read full disclaimer and privacy policy before reading any of our content.


