UPFINA's Mission: The pursuit of truth in finance and economics to form an unbiased view of current events in order to understand human action, its causes and effects. Read about us and our mission here.
Reading Time: 4 minutes
January will be interesting for the market and not just because some people will take profits in the hottest stocks because they delayed selling to avoid taxes for a year. The main issues in play are stimulus, the election, and the vaccines. This is like déjà vu for the market because we just got a stimulus and the election was in November. The Georgia Senate races are going to determine the balance of power in the Senate on January 5th.
There isn’t as much hedging as there was around the November presidential election. The unwind of the hedges and the vaccine news caused the massive rally in November. The other difference is the two races are very unpredictable. The polls are much closer than the presidential ones as Biden was leading solidly before the election. One of the takeaways after the November election was that there wasn’t a blue wave. This was bullish for the long bond. If the Dems win both seats, that trade reverses and yields will spike.
While the stimulus was just passed, the economy probably won’t be fully recovered within the 11 weeks unemployment checks will go out for. Furthermore, there were talks of a $2,000 stimulus that didn’t lead to a Senate vote. Another stimulus might come if the Dems win the election.
Finally, vaccine distribution is starting to pick up which could mean the beginning of the end of this virus is finally here. The speed of the distribution and how it is executed with a new administration (Biden) coming in are important variables. As of January 3rd, 4.33 million doses were given. That hasn’t had any noticeable impact on hospitalizations which are still at a record high. The COVID-19 data has been incomplete to start the year because of the holiday.
Biggest Stock Market Recovery Ever
The stock market had its biggest drawdown ever in a year it ended positively. It’s not like the market was barely up either. This was a better than average year as the S&P 500 rose 16.26% in 2020. As you can see from the table below, the maximum drawdown in 2020 was 33.9%. This drawdown size was typical for a year with a bear market except we didn’t actually have a bear market.
That was a crash similar to the one in October 1987 and Q4 of 2018. If the pandemic would have been first discovered in September instead of January/February, the market would have had a bad year (timing was different than the other two crashes). This was much different than a regular cycle because there wasn’t a debt overhang that was unwound and we got a stimulus very quickly.
Earnings Versus Stocks
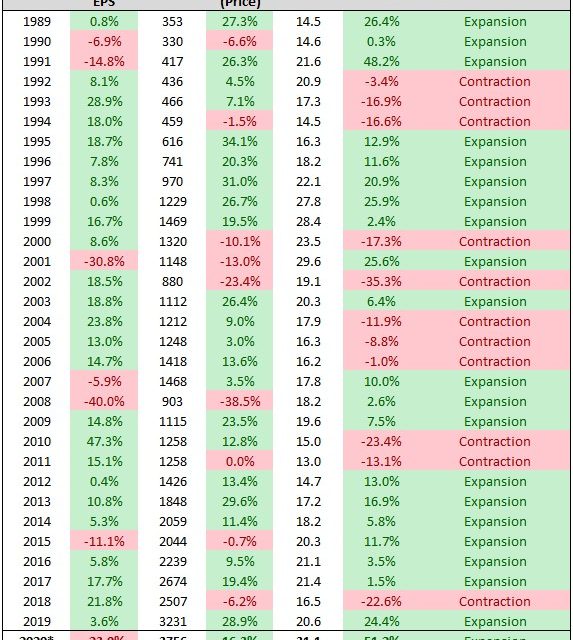
If you just look at the market by year, you can see earnings and stock prices don’t always correlate. In the long run, stocks need earnings to maintain their uptrend. Yearly data doesn’t tell the whole story because intermediate term stock prices are all about earnings expectations. As you can see from the table below, in 2020 operating earnings fell 23% while the stock market was up 16.3%. The S&P 500’s trailing 12 month PE ratio is higher than any year end since at least 1989. Furthermore, the price increase beat earnings growth by the most since at least 1989.
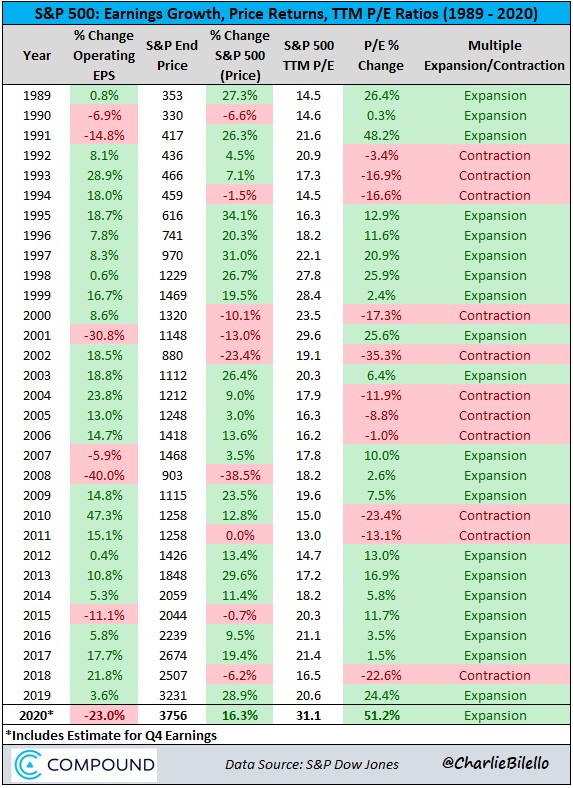
In 3 of the 7 years EPS fell, stocks were up. Last year was one of the years stocks rallied. In 5 of the 9 times stocks fell, EPS growth was positive. Even 20% EPS growth doesn’t guarantee stocks will have a good 2021 because of how expensive the starting point is. In 6 of the 11 years there was multiple contraction, stocks actually rose. It’s possible stocks rise less than earnings, but the high starting multiple makes it less likely.
In 1991, the stock market beat earnings growth by 48.2% bringing the TTM PE ratio to 21.6. There were 3 years of multiple contraction following that point. The good news is stocks only fell in 1 of those years. The bad news is the best year was 7.1% (which is below average). 2021 EPS growth is set to be very strong, but that doesn’t mean stocks will do well since we could be in line for multiple contraction. You can see the large multiple expansion in the past 2 years in the chart below.
Q2 GDP Growth Set To Be Strong
High frequency mobility data has been weak, but other metrics show better results. In the week of December 26th, yearly growth in the NY Fed’s weekly economic index improved to -1.32% from -1.95%. The two week stretch where growth fell ended with the past two weeks of improvement. The weekly leading index’s growth rate surpassed its 13 week average in the week of June 6th and never reversed course.
The ECRI leading index rose from 147 to 147.5 in the week of December 25th. It is being helped by the stock market and commodities prices. Its yearly growth rate spiked to 15.2% from 14.5%. Everyone is expecting a massive year for the economy because the virus will be contained (hopefully) and the stimulus will spur growth. 2020 was a terrible year, yet we are ending it with a lot of optimism. That’s despite the fact that there are record high hospitalizations and there will be a lot of COVID-19 deaths in January.
According to Goldman Sachs, the $900 billion stimulus that already passed caused it to raise its Q1 GDP growth forecast from 3% to 5%. They kept their sequential growth rate estimates unchanged at 8.5%, 5%, and 4%. This caused its overall 2021 annual growth estimate to rise from 5.3% to 5.8%.
Conclusion
2021 is starting off with important news on vaccines, the elections, and stimulus. 2020 had the biggest drawdown in a positive year ever. 2021 is set to have strong EPS growth, but multiple contraction will probably limit the potential gains. We might even see losses even with +20% EPS growth. Despite the weakness in mobility, the NY Fed’s weekly economic index and the ECRI leading index show better growth. Goldman is forecasting higher 2021 GDP growth because of the stimulus. If another one passes, growth could be even higher which would probably also lead to excess inflation.
Have comments? Join the conversation on Twitter.
Disclaimer: The content on this site is for general informational and entertainment purposes only and should not be construed as financial advice. You agree that any decision you make will be based upon an independent investigation by a certified professional. Please read full disclaimer and privacy policy before reading any of our content.


