UPFINA's Mission: The pursuit of truth in finance and economics to form an unbiased view of current events in order to understand human action, its causes and effects. Read about us and our mission here.
Reading Time: 5 minutes
If the housing market weakens further, which isn’t what we think will happen, there isn’t much room for it to fall. Housing starts can’t fall much because they haven’t risen much this cycle. As you can see from the chart below, the residential credit availability index is nowhere near its peak in 2006.
We’ve seen the real residential component of GDP fall 5 straight quarters and the economy isn’t close to a recession. 2018 was a strong year, while Q1 2019 wasn’t that great for the overall economy.
There’s no doubt, rising interest rates and a weakening labor market would hurt housing. The housing market isn’t impenetrable; it just won’t crash the economy like it did last time, as we have discussed before at length. We know high interest rates would hurt housing just by looking at 2018 and those rates weren’t even high based on historical standards. A high unemployment rate would shrink demand for housing, but we’re waiting to see which catalyst can turn the labor market. The housing market leads the economy and has been weak for a few quarters. It’s an indicator, but won’t be a catalyst for changes to the economy.
Case-Shiller Home Price Growth Faulters
We discussed in a previous article that the February FHFA home price index showed house price growth was the lowest in 4 years. The February CoreLogic Case Shiller home price index showed even worse results. The 20 city composite index was up 0.2% month over month on both a seasonally and non-seasonally adjusted basis. On a non-seasonally adjusted yearly basis, growth was 3% which was down from 3.5% in January and missed estimates for 3.2% growth. This is the lowest growth rate since August 2012.
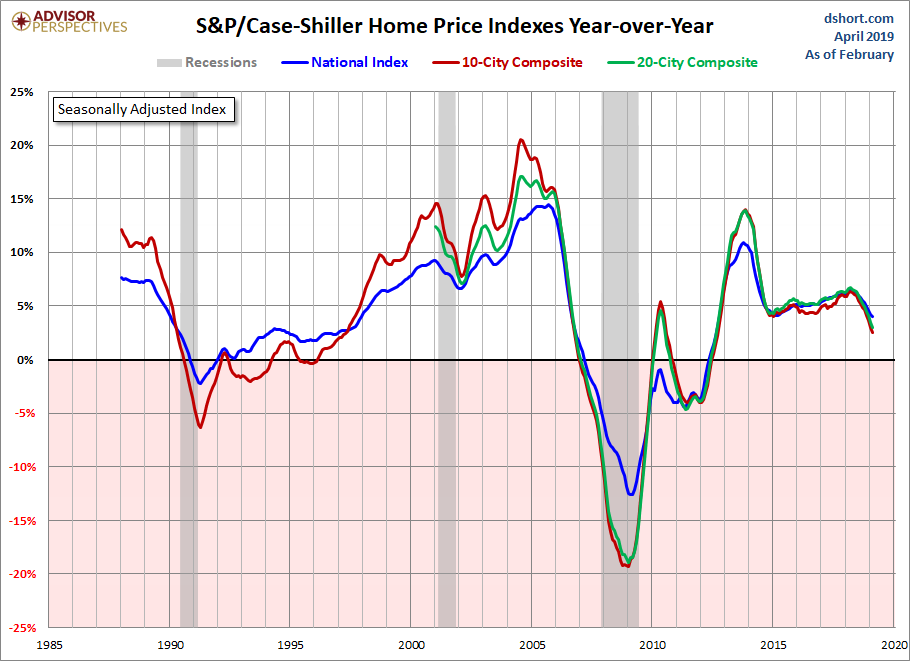
The seasonally adjusted national home price index was up 4% yearly as the chart above shows. With falling interest rates, housing started to become more affordable in some areas in a sequential basis. However, nationally, on a yearly basis, the situation actually got worse, although at a lesser rate. Average weekly earnings growth was 3.1% in February. That’s still below the national level price improvement. In February, 30 year rates averaged 4.37%. That’s down from the monthly peak of 4.87% in November, but actually 4 basis points higher than February 2018. Therefore, yearly house price growth was quicker than weekly wage growth and interest rates increased slightly.
The interest rate comparison will get easier later in the year, the tight labor market should push up nominal weekly wage growth, and home price growth could fall a bit more. Therefore, it’s fair to see a scenario later in the year where housing gets more affordable on a national level. Since the Case Shiller index is from back in February, housing could be at that point now. If you’re curious, in the past four weeks rates have risen as the 30 year mortgage rate increased from 4.06% to 4.2%. In March weekly wage growth was 3.2%.
Individual City Home Price Growth
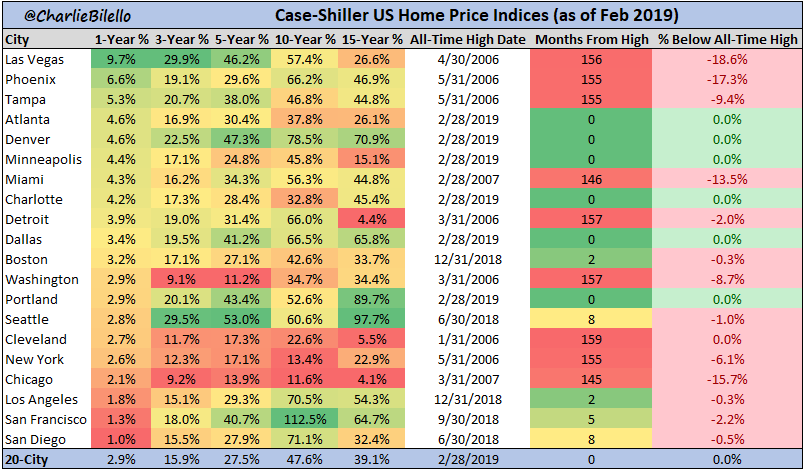
The city by city results showed a continuation of the recent trends. Phoenix and Las Vegas have been the hottest markets recently. Seattle, Portland, and Denver have cooled off significantly. New York, Chicago, and Los Angeles have been weak for a while. Specifically, Los Angeles had a 0.1% monthly decline, and Portland and Seattle had a 0.1% monthly gain.
As you can see from the table below, Las Vegas had the quickest yearly price growth as it was 9.7%. It’s interesting to see that even though it had the highest yearly growth, prices are the furthest from their all-time high as they are down 18.6% from April 2006. Even this hot area has seen some rate of change weakness in the past few months. Yearly price growth peaked at 13.8% in August 2018 and has since cratered every month (growth is 9.7%). That’s not a surprise because prices are cyclical and can’t increase in the low double digits forever.
Denver has had a similar drop, but growth has fallen to a lower level (4.6%). Growth recently peaked at 8.5% in March 2018 and has fallen every month since. Finally, Seattle has seen the steepest drop off as it is nearing outright yearly declines. Its growth rate peaked 13.5% in May 2018. Its 2.8% growth rate is the lowest since June 2012.
The updated median home price growth in San Francisco looks even worse than the February Case Shiller report indicates and it was already the 2nd worst city on that list. In March, San Francisco bay area home prices fell 0.1% yearly which was the first decline in 7 years. Median home prices had increased 83 straight months since April 2012. The fundamentals of this area look weak as sales were down 15% yearly to an 11 year low. They fell 10 straight months. Compared to national levels these houses are unaffordable as the median value is $830,000.
Pending Home Sales Index Improves
Maybe we are in the later innings of this decline in home price growth. The March pending home sales index led by the South saw a nice sequential pickup. On a month over month basis, the pending home sales index was up 3.8% which beat estimates for a 0.7% increase and beat the high end of the consensus range which was 2.5%. Last month saw a 1% decline. The overall index increased from 101.9 to 105.8. The West had an 8.7% monthly jump and the South had a 4.4% monthly increase. As the map below shows, the South’s index was 127.2 which was up 0.7% yearly. It is seeing historically high home sales activity. The other regions are below average.
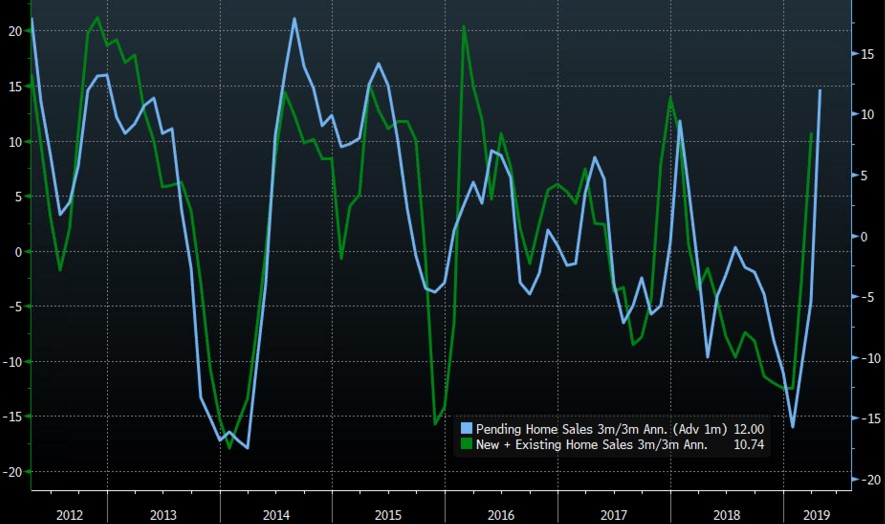
As you can see from the chart below, the pending home sales index’s quarter over quarter annualized growth rate pushed ahead 1 month correlates with the new plus existing home sales’ quarterly annualized growth rate. That’s a good sign for next month’s new and existing home sales reports.
Conclusion
Even with a strong labor market and sequential decline in interest rates, the housing market showed declining price growth in February. National home price growth is still above weekly average earnings growth. Their paths could cross in the next few months if they continue their recent trends. That along with falling rates could help the housing market bottom. At least the March pending home sales report showed sequential improvement
Have comments? Join the conversation on Twitter.
Disclaimer: The content on this site is for general informational and entertainment purposes only and should not be construed as financial advice. You agree that any decision you make will be based upon an independent investigation by a certified professional. Please read full disclaimer and privacy policy before reading any of our content.


