UPFINA's Mission: The pursuit of truth in finance and economics to form an unbiased view of current events in order to understand human action, its causes and effects. Read about us and our mission here.
Reading Time: 5 minutes
It’s very easy to get caught up in the housing bubble talk because many indicators in November and December showed weakness and the last cycle ended with a housing bubble burst. Plus, when you add in the fact that the housing market leads the economy, housing has become unaffordable, and 8 out of the past 10 recessions have been catalyzed by weakness in residential investment, now seems like the perfect time to be negative.
When you only list the negatives, the situation looks dire, but we don’t do that because that’s not the full story. We believe in garnering long term readers versus short term click bait (even if that means less readers). Consistently perma bullish or bearish commentary leads to readers paying the ultimate price, wasting their time.
The positives aspects of the housing market are that interest rates have fallen, the consumer has deleveraged this cycle, especially in terms of housing debt, private lending standards are much higher than the previous cycle in terms of credit scores and due diligence (zero doc loans are illegal), housing wasn’t built up as much as last cycle, and prices haven’t soared as high in real terms.
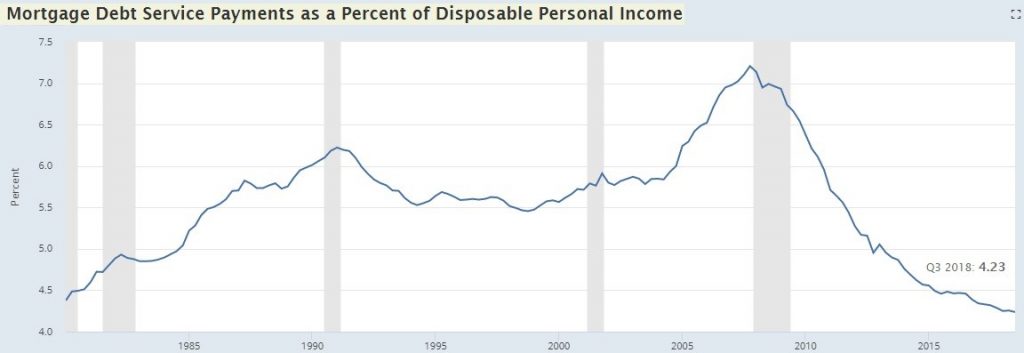
When stats are in nominal terms they are deceiving. For instance, housing debt peaked at $9.99 trillion in Q3 2008. If you just wait until that level is reached again to claim there’s a bubble, you will be grasping at straws because every year there is inflation and population growth. The current $9.54 trillion in housing debt is much more sustainable. Even in a recession, delinquencies won’t get as high as they did during the last recession. The chart below proves housing debt isn’t a problem because it shows mortgage debt as a percentage of personal disposable income is the lowest since at least 1980.
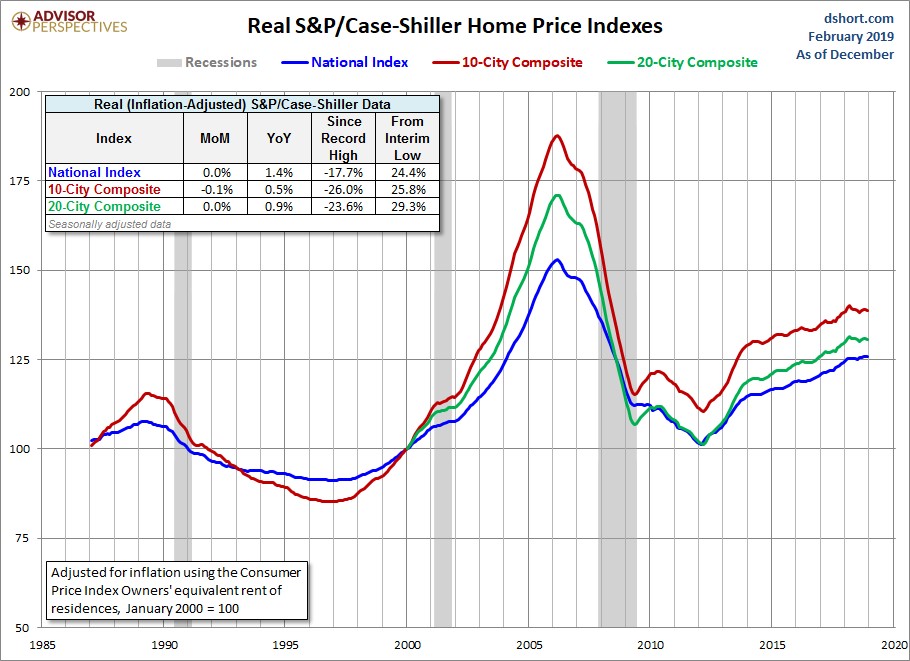
Another example is looking at nominal home prices. It would be ridiculous to assume house prices would never get back to their 2006 peak because house prices have historically risen. Nominal wages have risen since 2006, so housing prices can rise above that level and still be affordable. Housing is currently unaffordable in some areas; the point here is prices rising above the 2006 level doesn’t equal a bubble. While the national, 10 city composite, and 20- city composite house price indexes are at a record in nominal terms, the chart below shows real prices are below their record high. If homes aren’t affordable, lower price growth will ensue, but there won’t be a bubble burst like 2008.
Latest MBA Applications Data
The MBA applications data is much more recent than the housing starts, the Case Shiller price index, and the existing home sales report. The MBA report from the week of February 22nd just came out while those previously mentioned reports recently had data from December and January (delayed because of the government shutdown). The latest MBA report showed the composite index increased 5.3% which was on top of a 3.6% increase from the previous week. The purchase index was up 6% on top of 1.7% growth.
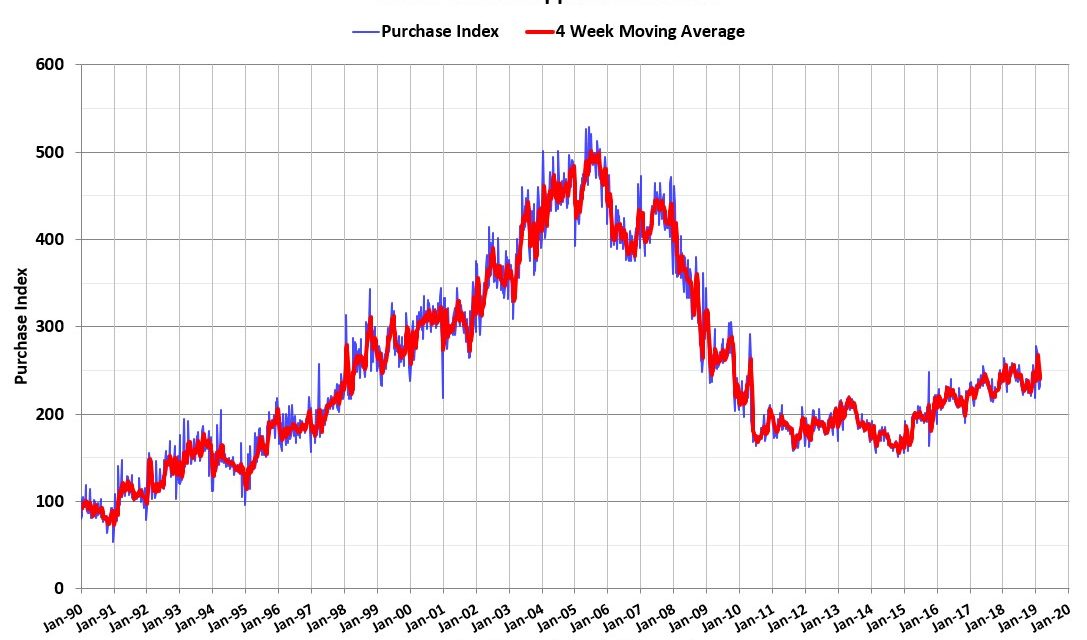
The purchase index is up 3% year over year as the chart below shows.
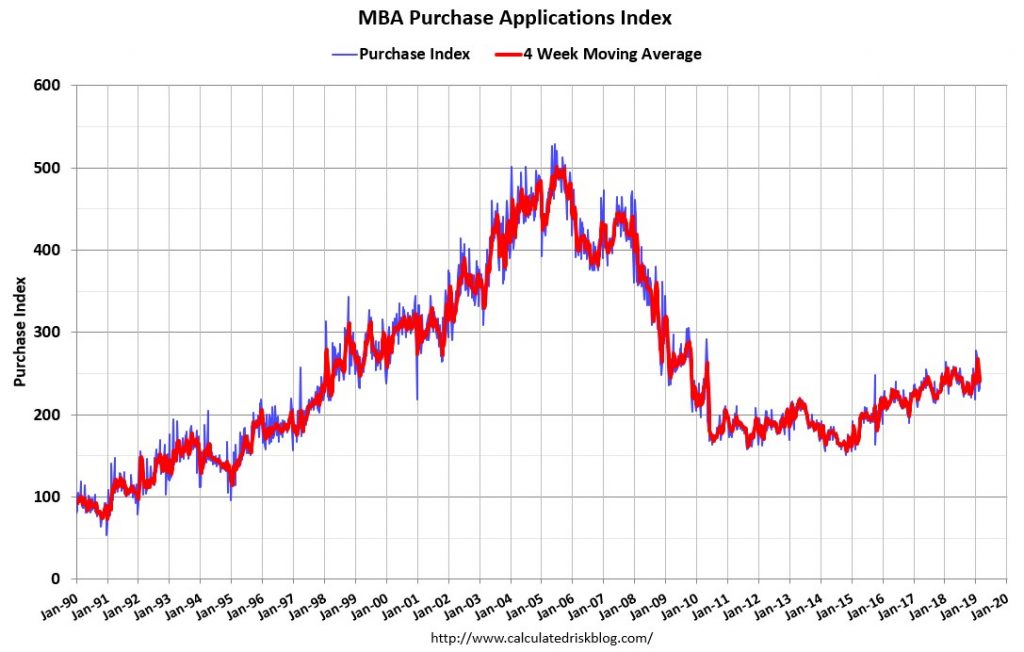
Refinance applications were up 5% on top of 6.4% growth. Borrowers love lower mortgage rates. The 30 year fixed rate declined from 4.95% in November to 4.35% in February. This decline didn’t affect the December housing reports. This chart supports our earlier point about housing not being in a bubble. Even though the purchase index is in a near 3 year uptrend, it is nowhere near the peak in 2005.
Pending Home Sales Rebound
Possibly because of the decline in interest rates, the pending home sales report rebounded in January. The index was up 4.6% monthly which beat estimates for 1% growth. This growth came on an easy comparison as growth fell 2.3% in December. The index increased from 98.7 to 103.2. Final sales of existing homes fell 8.9% in January, but this report signals future strength. The chart below shows pending home sales are highly correlated with existing home sales lagged 18 months.
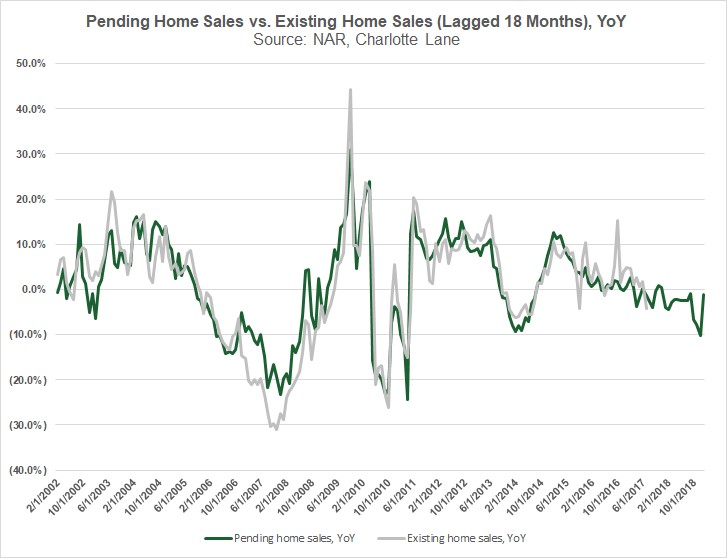
Yearly pending home sales fell 2.3%, but that’s still a big improvement from last month. The West was the weakest area as its index fell 10.1% year over year; sales were up 0.3% monthly. Sales in the Midwest were down only 0.3% yearly. Year over year sales in the South were down 3.1%, but they were up 8.9% monthly. The best yearly growth was in the Northeast as its pending home sales index increased 7.6% to 94. When the index is above 100 it coincides with high sales activity. The South’s reading of 119.8 dragged the overall index higher because it is by far the largest market.
Zillow’s Housing Projections
Zillow’s house price growth projections have a good track record, so they are worth following closely. Since 2011, Zillow’s historical absolute error in predicting 10 city and 20 city price growth on a monthly and yearly basis is just 0.2% (both seasonally adjusted and non-seasonally adjusted). The historical absolute error since 2014 for national price growth is 0.1% on a monthly and yearly basis (both seasonally adjusted and non-seasonally adjusted).
As you can see from the table below, growth is projected to fall further in January.
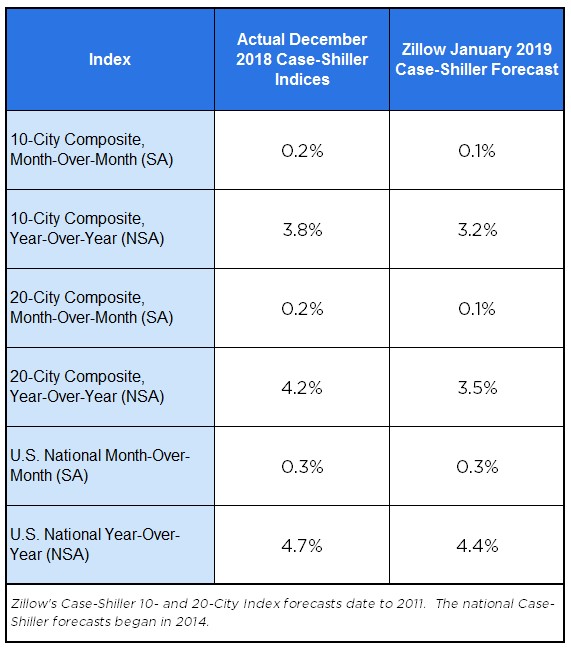
The 10 city composite’s yearly growth is expected to fall from 3.8% to just 3.2%. The 20 city’s price growth will fall from 4.2% to 3.5%. Finally, national price growth is expected to fall from 4.7% to 4.4%. That would be the weakest price growth since July 2015. Some are predicting yearly price growth to fall below inflation this year. If this cyclical price weakness coincides with labor market weakness, then growth could fall to the flatline as increased affordability doesn’t matter if people don’t have jobs. Weak price growth is terrible for home improvement retailers and home builders. It is good for the homeownership rate if the labor market holds up.
Conclusion
The housing market isn’t in a bubble as the consumer is spending a low percentage of their disposable income on servicing mortgage debt, housing starts per capita are low, and real housing prices haven’t hit the 2006 peak. The good news is MBA purchase applications have been up recently and pending home sales improved from December. The bad news is home price growth is set to fall in January. At least that will help the homeownership rate, making housing more affordable.
Have comments? Join the conversation on Twitter.
Disclaimer: The content on this site is for general informational and entertainment purposes only and should not be construed as financial advice. You agree that any decision you make will be based upon an independent investigation by a certified professional. Please read full disclaimer and privacy policy before reading any of our content.


