
UPFINA's Mission: The pursuit of truth in finance and economics to form an unbiased view of current events in order to understand human action, its causes and effects. Read about us and our mission here.
Reading Time: 4 minutes
Our readers are well aware that many important news events are coming out in October. There are trade negotiations with China and Europe, the Democratic primary debate, the Fed meeting, economic reports, and earnings season. October is the most volatile month historically. Usually, stocks are the most volatile in the first half of the president’s term because that’s when legislation gets passed. Stocks like gridlock rather than big pieces of legislation because they create uncertainty. There wasn’t much volatility in the first half of Trump’s term because of the tailwind of the cyclical upturn and because the legislation that was passed was business friendly (corporate tax cut).
Potential Volatile Patch
Even though the 3rd year of a President’s term tends to be good, there is sometimes volatility in the fall because parties are sorting out who their nominee will be. There’s a lot of uncertainty as there are a few options. The chart below shows that since 1950 stocks have fallen in this period (pre-election fall season).
In the current scenario, it seems Warren and Biden are very close as the average of the recent national polls has Biden up by 0.2%. Their potential policies differ widely (Biden moderate & Warren left leaning) which could cause volatility as the market waits for clarity. It helps stocks that in presidential elections, both candidates try to appeal to independents by toning down their rhetoric.
Neutral September Fed Minutes
The September Fed Minutes were mixed because members disagreed on policy. It was ironic to see the Minutes state the market may have gotten ahead of itself in terms of expecting rate cuts because the market reacted to the Minutes by pricing in higher expectations for rate cuts. Specifically, the Minutes stated, “a few participants” at the September meeting said futures markets “were currently suggesting greater provision of accommodation at coming meetings than they saw as appropriate.” Furthermore, because of the misunderstanding, “it might become necessary for the Committee to seek a better alignment of market expectations regarding the policy rate path with policymakers’ own expectations for that path.”
The Fed funds futures market sees an 85% chance of a rate cut in October and a 45.2% chance of another cut in December. That’s potentially four meetings in a row with a cut. If the Fed wants the market to expect fewer cuts, it needs to have more hawkish rhetoric. That’s tough with trade negotiations deteriorating. It’s also tough to have any sort of united front because members aren’t in agreement. The dot plot shows five members seeing no more cuts this year, five seeing a hike soon, and seven wanting another cut. If the Fed can’t influence the futures market because it is in disagreement, it will be beholden to the market. Once the market prices in an action by decision day, it’s too late to go against expectations. That would create uncertainty for future decisions. The market already has enough uncertainty on the trade front.
Sequentially Weak August JOLTS Report
We described the July JOLTS report as strong because it had the 2nd most hiring of the cycle. We said it was strong even though job openings fell since hires matter more than openings. An opening doesn’t mean anything if it doesn’t get filled. The August reading was different as openings and hires fell. It was a sequentially weak report. Openings fell from 7.174 million to 7.051 million which missed the low end of the consensus range which was 7.1 million. The July reading also was revised lower from 7.217 million.
On an absolute basis, job openings have worsened from fantastic to great since there are still more openings than unemployed workers as you can see from the chart above. If all the openings were filled by people looking for work, no one would be looking for work. That’s pretty good. The negative is yearly growth was relatively weak and almost looks like the economy is near a recession. Yearly growth fell from -3.6% to -4%. That’s the worst yearly growth since March 2017. The trough last slowdown was -5.9% in January 2017. As you can see in the chart below, the decline in openings in the past year has been concentrated in retail trade. 4.29% of the 9.22% decline came from retail.
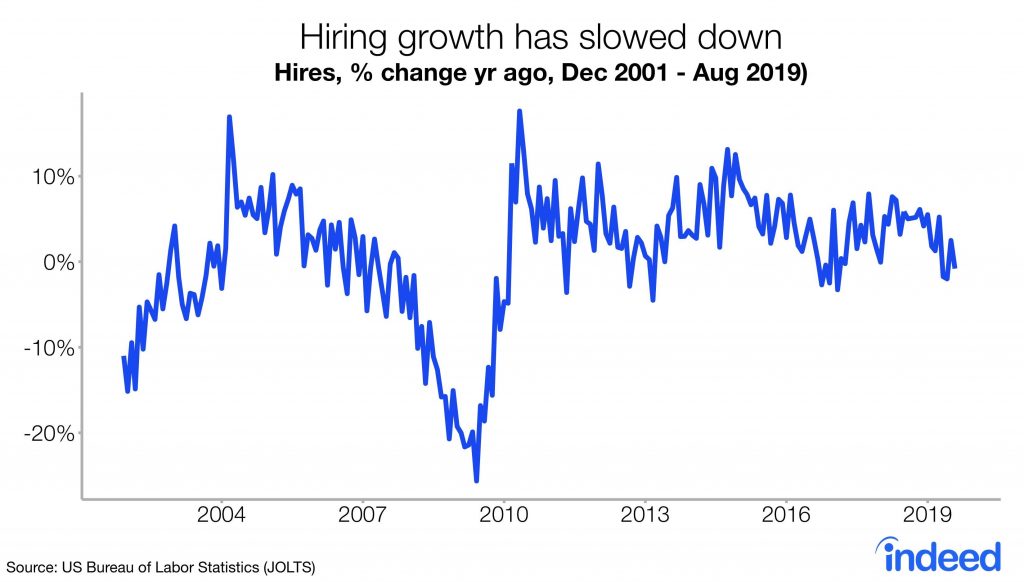
Hiring fell from 5.978 million to 5.779 million. That’s only the weakest reading since June. That ends the fear of a recession coming soon. Hiring growth wasn’t as bad as openings growth as you can see from the chart below. Growth fell from 2.5% to -0.8%. That’s the weakest growth since June. In the last slowdown, yearly growth fell to -3.3% in February 2017.
Construction hiring was up from 374,000 to 418,000 and manufacturing hiring fell from 338,000 to 329,000. Weakness was centered in professional & business and education & health services. Professional and business hiring fell from 1.18 million to 1.097 million which was the worst reading since January 2018. This isn’t great on a nominal basis let alone on a rate of change basis. Similarly, education and health services hiring fell sharply from 750,000 to 677,000. This could just be a random decline. They have been common.
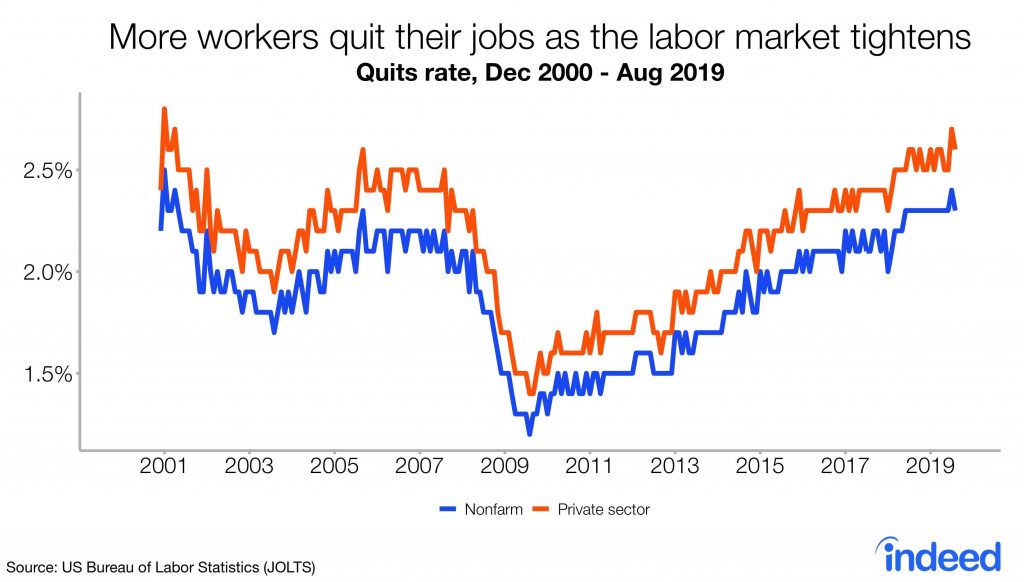
Finally, quits also fell which signals less movement in the labor market. This is bad for workers as job switchers have higher wage growth than those who stay at their job. As you can see from the chart below, the quits rate fell from 2.4% to 2.3%. That’s still a high reading. It falls slightly during expansions all the time. Specifically, quits fell from the cycle high of 3.668 million to 3.526 million. Growth went from 6.5% to 1.5%.
Conclusion
The Fed Minutes claimed to want to extinguish expectations for cuts, but it caused the market to expect slightly more cuts. The Fed is almost locked into a rate cut in October especially because of the negative news on trade. The JOLTS report showed sequential weakness. Openings went from amazing to great. On an absolute basis, there’s little to worry about, but growth is headed in the wrong direction.
Have comments? Join the conversation on Twitter.
Disclaimer: The content on this site is for general informational and entertainment purposes only and should not be construed as financial advice. You agree that any decision you make will be based upon an independent investigation by a certified professional. Please read full disclaimer and privacy policy before reading any of our content.


