UPFINA's Mission: The pursuit of truth in finance and economics to form an unbiased view of current events in order to understand human action, its causes and effects. Read about us and our mission here.
Reading Time: 4 minutes
Considering how close the stock market is to its record high, it’s surprising how bearish investors are. They are clearly worried about the Democratic primary, the trade war with China, the tariffs on Europe, early weak results from earnings season, and the Fed’s rate cuts. Regarding earnings season, the results don’t look great. Specifically, 91% of the first 22 S&P 500 firms to report results have had their Q4 estimates lowered. Only 55% of firms have beaten sales estimates which is below the 3 year average of 71%. The average EPS surprise is 2.36% which is way below Q2’s 5.48% and the 3 year average of 4.09%. The one positive data point is 86% of firms have beaten EPS estimates on 3.8% growth.
Getting back to the negative sentiment, the CNN fear and greed index (October 10th) is at 36 which is fear. Flows into money markets are among the highest in decades and are almost at the March 2009 panic high. The NDR daily trading sentiment survey is at 28.89 (October 9th) which is in the extreme pessimism category (below 41.5). Since the end of 1994, the S&P 500’s annualized returns in this category are 29.82%.
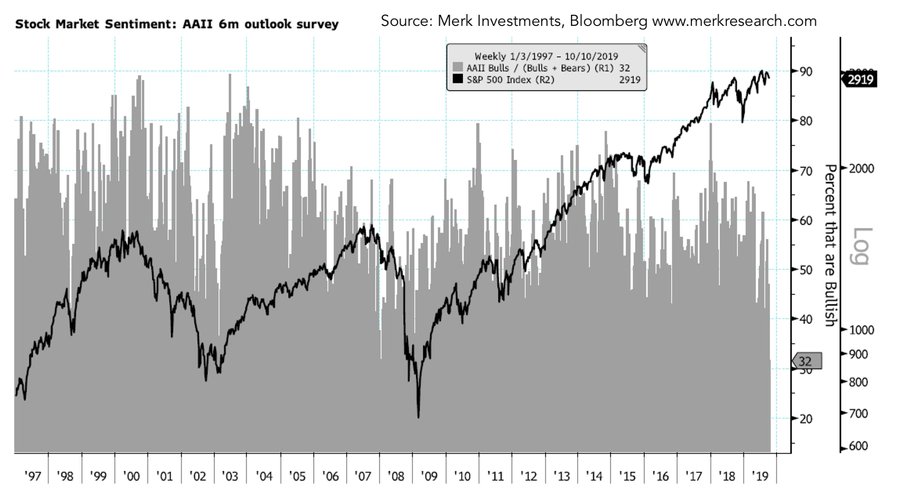
The AAII investor sentiment survey published on October 9th shows the same negativity. The chart below shows the percentage of bulls is at an extreme low.
The survey shows the percentage of bulls fell 1.1% to 20.3% which is the lowest since mid-2016. The historical average is 38%. The percentage of bears rose 4.5% to 44% which is the highest since August. The historical average is 30.5%.
Soft Data Is Very Bearish
Sentiment is worse than reality whether you’re looking at the survey of CEOs’ opinions on the economy, the level of bullishness of investors, or soft economic data. As you can see from the chart below, Cornerstone Macro’s GDP barometer has Q3 year over year real GDP growth coming in at 2.1%.
The soft data pushed ahead by two quarters shows growth at just 0.8%. If it acts as a leading index, growth will be very weak in 1H 2020 since it is negative. Sentiment is being hurt by the trade war. If the tariffs are implemented, the trade war will be a much bigger headwind to growth in 2020 than it was in 2018 and 2019. It’s notable, that this soft data barometer was more negative in 2016. We’ve been trying to figure out if this slowdown will get worse than the one from 2015-2016 because if it does, the odds of a recession are significant. There isn’t much daylight between the 2015-2016 slowdown and a modest recession.
Jobless Claims Are Low
We see investors claiming jobless claims are signaling a recession is coming because they have been range bound. That’s a misnomer because jobless claims are very low. They are already the lowest in relation to the population ever. They can’t get much lower. Fear claims when they spike sustainably, not when they are below 250,000. As you can see from the chart below, non-seasonally adjusted claims are 173,000 which is over 20,000 below last year.
On a seasonally adjusted basis, claims fell from 220,000 to 210,000 in the week of October 5th. The four week moving average rose 1,000 to 213,750. To be clear, jobless claims are in the leading indicators index. It’s not signaling a recession is close.
CPI Misses Estimates & Falls
This September CPI report is basically the same as August in that core CPI was above 2% and above headline CPI which was dragged down by energy. The core CPI reading was pushed higher by healthcare services again. Specifically, CPI was 1.7% which was the same as August, but missed estimates for 1.8%. On a rounded basis, core CPI met estimates and August’s reading of 2.4%. It actually fell 3 basis points to 2.36%. The 2 year stack fell 6 basis points because core inflation fell 3 basis points last year. This slight decline implies core PCE inflation will be below 2% again. This allows the Fed to cut rates in October.
Energy drove inflation lower again as it was -4.8%. This is important since we use headline CPI to measure real wage growth. Weekly wage growth was above inflation as it was 2.6%. Food inflation was just 1.8% because it was dragged down by food at home inflation which was 0.6%. Probably because of wage inflation, food away from home inflation was 3.2%. Core commodities inflation was only 0.7%. The driver of core inflation was once again services as it was pushed up by medical services and shelter inflation. Transportation inflation was only 0.8%. New vehicle inflation (core commodities segment) was only 0.1% as auto firms are giving record incentives.
Shelter inflation always drives core price growth because it is a large component (rent of shelter is 33% of CPI). It was 3.5% in September. It has been range bound for a few years. Since July 2015, it has been between 3.1% and 3.6%. As you can see from the chart below, Enduring Investments sees owner’s equivalent inflation (which is based on rents) falling very slightly in the next year.
Medical care services inflation (8.7% of CPI) increased 0.1% to 4.2% which is the highest rate since September 2016. Health insurance inflation drove the category again as it increased from 18.6% to 18.8%.
Warren Expected To Be President
To those who don’t think we should be looking at the election yet, recognize the odds are being traded. Forward looking investors are pricing in a Warren nomination. As you can see from the chart below, Warren has a 48% chance of winning.
To be clear, we aren’t predicting she will win. We’re just saying you must be following the polls closely if you’re trading healthcare or bank stocks. In the latest Fox News national poll, Biden was up by 10 points, but Warren gained 6 points since September (she was in 3rd in September). Biden gained 3 points. The October 15th debate will have 12 candidates on stage. So far, 8 candidates have made the November 20th debate.
Conclusion
Investors are bearish which is good for stocks. The soft data signals the economy is weak, but the hard data isn’t terrible. Jobless claims are very strong, similar to hiring in the August JOLTS report. Inflation fell slightly. Core PCE inflation will stay below 2%. Warren is expected to be the Democratic nominee in 2020.
Have comments? Join the conversation on Twitter.
Disclaimer: The content on this site is for general informational and entertainment purposes only and should not be construed as financial advice. You agree that any decision you make will be based upon an independent investigation by a certified professional. Please read full disclaimer and privacy policy before reading any of our content.


