UPFINA's Mission: The pursuit of truth in finance and economics to form an unbiased view of current events in order to understand human action, its causes and effects. Read about us and our mission here.
Reading Time: 4 minutes
The Fed’s two mandates are stable prices and maximum employment. Skeptics think the third, most powerful mandate, is to keep the S&P 500 up. To be fair to the Fed, the stock market is a leading indicator of the economy, so if the stock market falls it could be a warning that the economy may be deteriorating. Also, if the stock market falls significantly, that could hurt the economy further through reflexivity. Bearish investors hate the concept of the Fed helping the stock market, but they are in a difficult position of managing not only the cost of currency, but perception and confidence in their ability to do so. None of us can control whether the Fed helps the market. We can only react to policies and changes to the economy. If you have been angrily short stocks since December because you are mad the Fed turned dovish, you have lost money trying to prove a point. You can utilize free speech to criticize any policy decision, but don’t involve your portfolio in philosophical arguments. Reality, just or unjust, and perception of reality, is what matters for portfolio returns.
When Will The Fed Cut Rates?
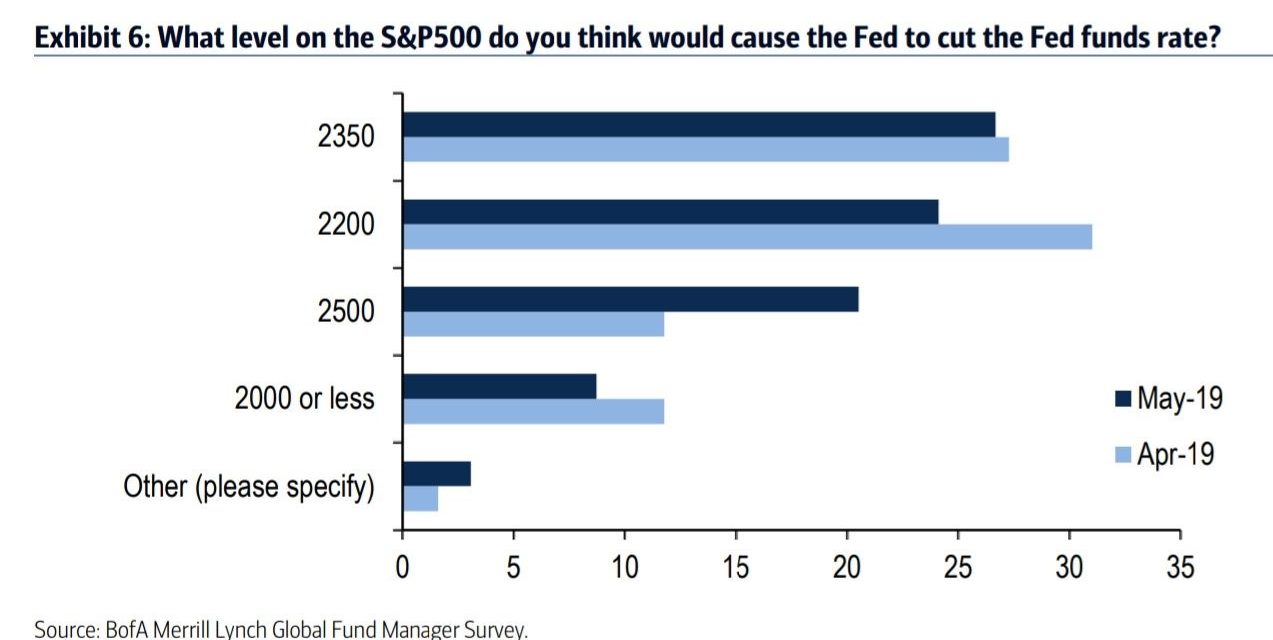
As you can see from the chart below, Merrill Lynch asked fund managers where the S&P 500 would need to fall to for the Fed to cut rates. The most popular answer was 2,350.
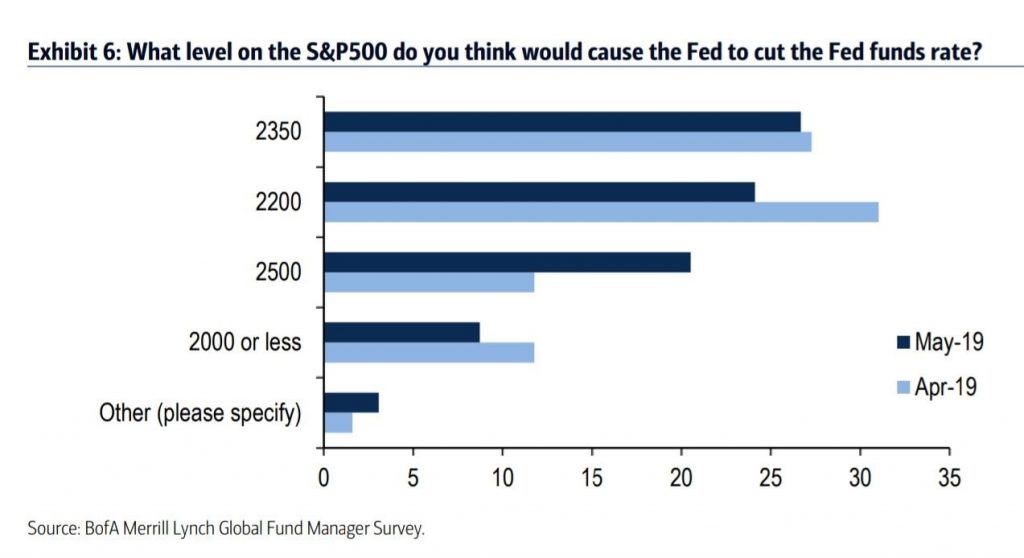
The S&P 500 was at 2,834 as of May 14th. We think this question is attempting to figure out when the market alone would cause the Fed to cut rates, because even with the stock market this high, the odds of a rate cut by the end of the year are 74.2%. It’s also possible fund managers don’t agree with those odds.
The Biggest Tail Risk
The stock market is stuck in a cycle. The good news is the stock market corrections make tariffs less likely. The bad news is a bull market gives policy makers more confidence to apply more tariffs. Even though the bulls don’t like this trade war, it’s a positive for them that policy makers respond to the stock market.
As you can see from the chart below, the trade war was considered the market’s biggest tail risk.
A tail risk is supposed to be a relatively low probability event that can cause big problems. This risk must refer to a global trade war because the trade war with China is already underway.
As you can see, in the May survey, less fund managers mentioned a Chinese slowdown as a tail risk. The Chinese slowdown has been underway for a few years, so this tail risk must refer to much more weakness. It appears fund managers were wrong in May to stop picking this as the biggest tail risk as the April economic reports from China were terrible. Specifically, industrial output growth was 5.4% which fell from 8.5% in March which was a 4.5 year high. The April reading missed estimates for 6.5%. Chinese retail sales growth fell from 8.7% to 7.2% which missed estimates for 8.6%.
As you can see from the chart below, this was the lowest growth rate since May 2003. This chart truly highlights how long the Chinese slowdown has been going on for.
Chinese auto sales fell 14.6% in April which was the 10th straight month of declines. Fixed asset investment growth was 6.1% in the first four months of 2019. Estimates were for 6.4%; growth was 6.3% in the first quarter. Private fixed investment growth fell from 6.4% in Q1 to 5.5% in the first 4 months of 2019. Finally, infrastructure spending growth was stagnant at 4.4%. As you can see, this was an across the board sharp slowdown which could signal the trade war is hurting China. It definitely signals the global economy is still weakening. This is a score for America in the trade war, but increases the cyclical headwinds for the economy.
Very Poor Cass Freight Index
The April Cass Freight shipments reading was terrible, signaling the American economy is in a slowdown. The movement of tangible goods is a great indicator for the health of the economy. Shipments growth is getting closer to the weakness seen in the 2015-2016 slowdown. As you can see from the chart below, shipment volume growth has been negative for 5 straight months. Shipments were down 3.2% and expenditures were up 6.2% yearly. The Cass Freight report stated, “we see material and growing downside risk to the economic outlook.” Furthermore, it stated, “the Cass Shipments Index has turned negative and is now signaling economic stagnation with the potential for contraction.” This is the exact weakness the ECRI leading indicator forecasted would happen in Q2 and Q3 at the start of the year.
International Earnings Were Terrible
FactSet’s data shows less EPS growth than The Earnings Scout’s data. If you follow FactSet, it’s possible EPS growth could be negative for 2 straight quarters (Q1 and Q2). With 90% of S&P 500 firms reporting earnings, EPS growth was -0.5%. Estimates for Q2 EPS growth are for -1.7%. The good news, which we mentioned in a previous article, is Q2 EPS estimates fell less than average in April.
As you can see from the chart below, the main catalyst for the potential EPS contraction in Q1 was multinational firms.
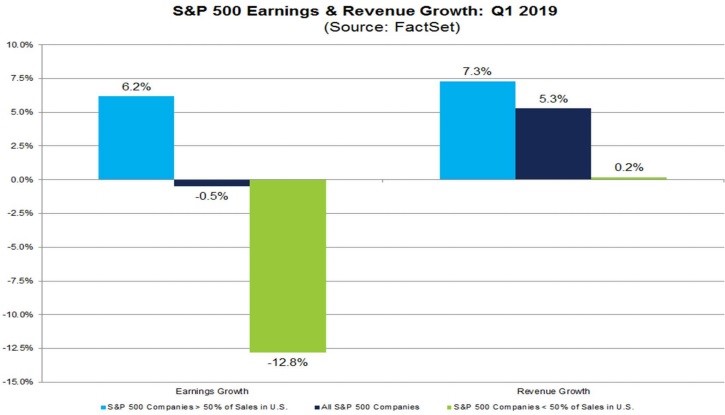
Firms with more than 50% of sales coming from outside America saw earnings decline 12.8% and sales only increase 0.2%. Firms with more than half of their sales coming from America had EPS growth of 6.2% and sales growth of 7.3%. The trade war will only increase the divide between domestic and multinational firms.
Conclusion
If the stock market declines, the Fed will be more likely to cut rates, but the market already expects a cut anyway because the American economy is in a slowdown. The stock market rallied earlier in the year on the basis of a trade deal and the slowdown not leading to a recession. Unfortunately, tariffs are increasing soon and the slowdown has only gotten worse according to the Cass Freight index. The only positive left is the dovish Fed. However, a rate cut won’t save the economy or the stock market. Chinese economic growth weakened rapidly in April; Q1 S&P 500 EPS growth was significantly hurt by multinationals.
Have comments? Join the conversation on Twitter.
Disclaimer: The content on this site is for general informational and entertainment purposes only and should not be construed as financial advice. You agree that any decision you make will be based upon an independent investigation by a certified professional. Please read full disclaimer and privacy policy before reading any of our content.


