UPFINA's Mission: The pursuit of truth in finance and economics to form an unbiased view of current events in order to understand human action, its causes and effects. Read about us and our mission here.
Reading Time: 5 minutes
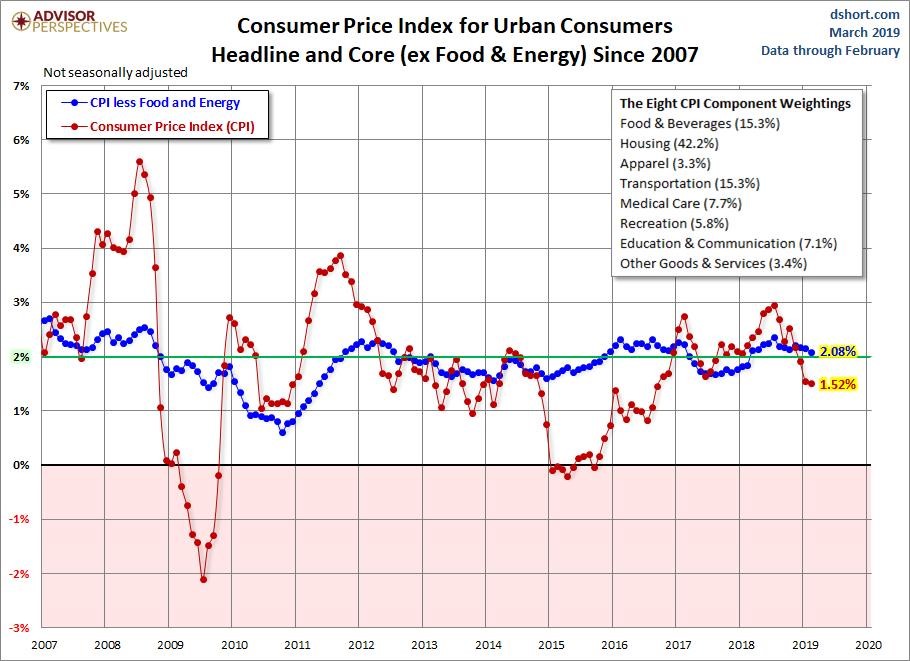
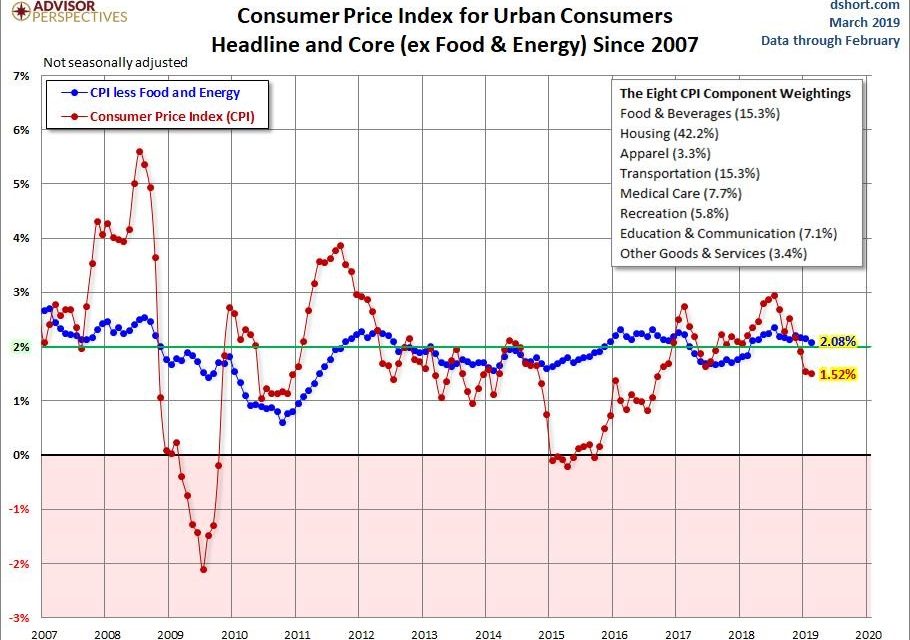
The all important February CPI report showed both headline and core inflation fell. That partially explains why stocks and treasuries have rallied this year. Treasury yields have embedded inflation expectations. Slowing economic growth and inflation have pushed them lower. Stocks like the dovish Fed which has been able to pause hikes because of the decline in inflation. Headline monthly inflation was 0.2% which was above last month’s reading of 0% and met the consensus. As you can see from the chart below, yearly headline CPI was 1.5% which fell from 1.6% and met the consensus.

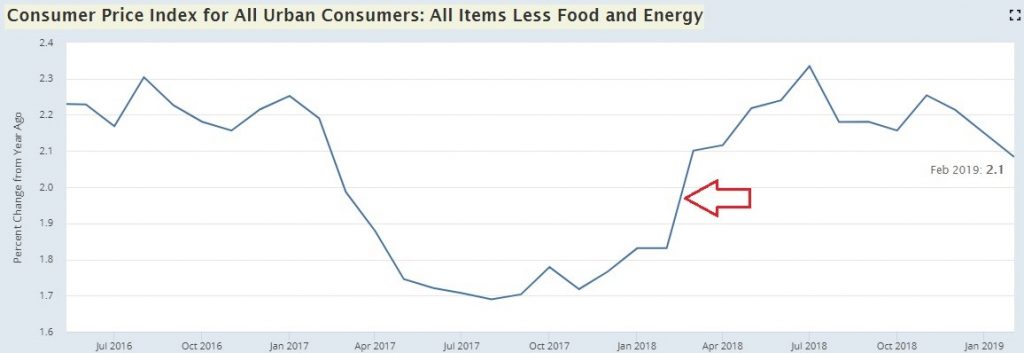
Core CPI determines Fed policy. Monthly core inflation was 0.1% which missed the consensus and last month’s reading of 0.2%. That was a relatively big miss since it rarely misses estimates and the unrounded inflation rate was 0.11047%. This was the case with yearly core CPI. As you can see from the chart below, yearly core CPI was 2.1% which missed the consensus and last month’s reading of 2.2%. The unrounded reading was 2.08361% which was the lowest since February 2018.
It’s interesting how close yearly core CPI has stayed to the Fed’s 2% target. Not including volatile food and energy prices makes it easier for the rate to stay consistent. If you believe core CPI is a good metric of inflation, then the Fed has done an amazing job of keeping inflation near its target. Lately, other developed economies have had a tough time getting inflation to increase enough to reach their targets.
The chart below has an arrow pointing towards the big boost in core inflation last March 2018. It went from 1.83% to 2.1%.

That tough comparison means core inflation will likely fall below 2% in the next reading. That will support the Fed’s patience. To be clear, patience means the Fed won’t hike rates this year. The Fed funds futures market shows there is a 79.2% chance the Fed doesn’t change rates this year and a 20.8% chance it cuts rates at least once. The Fed will update its guidance for the first time since the December meeting at its meeting on March 20th.
Details Of The CPI Report
The results we will review next are not seasonally adjusted and show yearly growth unless otherwise specified. Food inflation increased from 1.6% to 2%. That’s the highest inflation rate since April 2015. Food away from home drove this category higher as its prices were up 2.9%, while food at home inflation was only 1.2%. In the food at home category, the strongest reading was ‘nonalcoholic beverages and beverage materials’ which was 2.8%. Food away from home inflation was almost evenly distributed between ‘full service meals and snacks’ and ‘limited service meals and snacks’ which had inflation of 2.8% and 3%.
Headline inflation was pushed lower by energy as it was -5% which was the weakest reading since August 2016. Energy commodities inflation was -8.6%. This decline was mainly driven by gas prices as they fell 9.1%; fuel oil prices fell 2.4%.
In the core inflation category, commodities prices less food and energy were only up 0.1%. This weakness in commodities inflation has helped core inflation stay within the Fed’s target. New vehicle prices were only up 0.3%. That makes sense when you consider how weak auto sales have been. Used car and truck prices were up 1.1% which signals demand for them increased as consumers found new vehicles unaffordable. Tobacco and smoking products had the highest inflation in this group as it was 3.7%. Cigarette firms raise prices to make up for the declining smoking rate. The two categories with negative inflation were apparel and medical care commodities which were -0.8% and -1.1%.
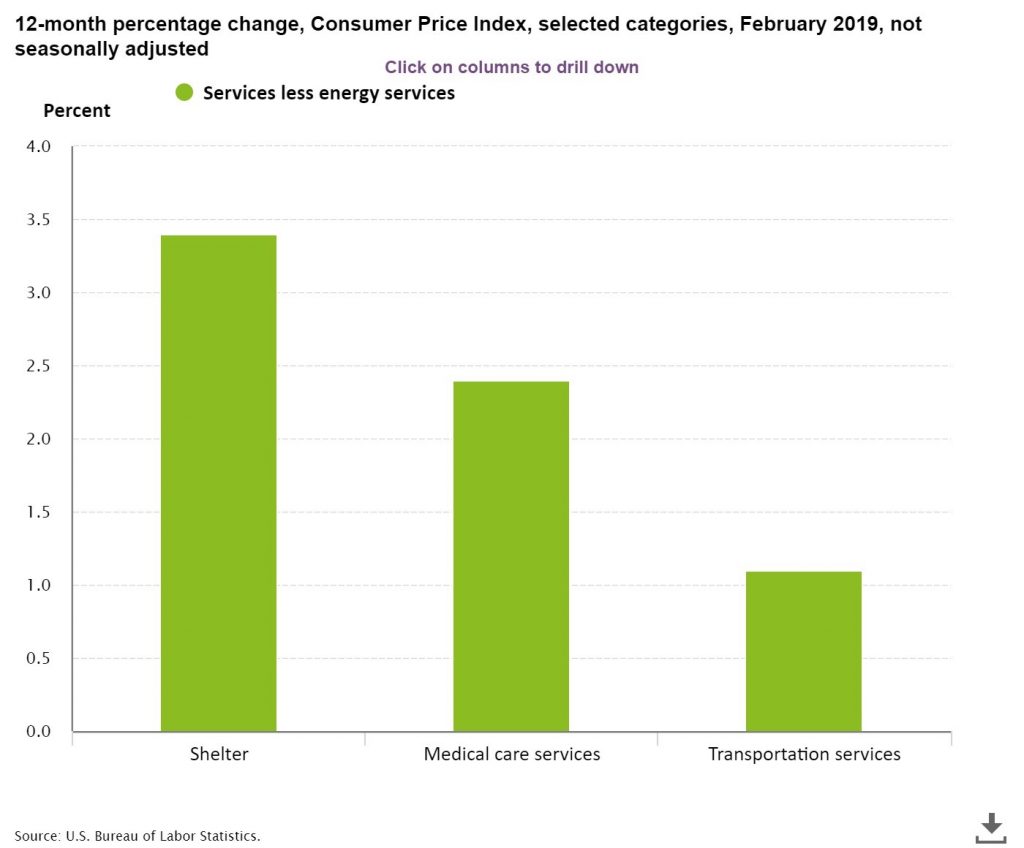
Service inflation excluding energy service was 2.7%. Service inflation is more likely to be impacted by wage growth as labor usage is higher. The chart below breaks down the parts of this group.

Even though home price growth has slowed, shelter inflation was up from 3.2% to 3.4%. As you can see from the first chart in this article, shelter is 42.2% of CPI. Medical care services inflation was 2.4% and transportation services inflation was 1.1% as it was limited by public transportation prices which fell 1.8%. Rent of primary residence and owners’ equivalent rent inflation were 3.5% and 3.3%.
Real Wage Growth Improves
As you can see from the top chart below, average hourly earnings growth deflated by CPI was 2.3% in February which is an expansion high.
When deflated by core CPI, growth accelerated to 1.4% which is the highest level since the beginning of the expansion. Current real wage growth is way more important because more people have jobs. This is the real wage growth acceleration we discussed would happen in an article a few months ago. The decline in oil prices and the tight labor market are a great combo to help workers. The Phillips curve is broken, meaning wage growth hasn’t catalyzed inflation. That means real wage growth is sustainable if the labor market stays strong.
Low wage workers are seeing the most benefits. This occurs at the end of expansions because low wage jobs have the most volatility. Those on the lowest rung are fired the quickest in recessions. They receive exceptional wage growth when the labor market is tight.
The chart on the bottom is notable because it shows real wage growth has been consistent ever since inflation stabilized in the mid-1990s. Real wage growth was very tough to achieve when inflation was high from the late 1960s to the early 1990s. Politicians love to harken back to various times in the past where workers supposedly were doing well. We just look at the objective facts.
The chart on the right shows production workers’ quarter over quarter annualized and year over year average wage growth. It has accelerated to 3.7% and 3.5%. That’s the best growth in about 10 years. To be clear about our point on stock buybacks, earnings growth accelerating as buybacks hit record highs doesn’t imply buybacks helped wage growth. We are just saying buybacks didn’t prevent real wage growth.
Conclusion
Inflation fell in February which helped real hourly wage growth hit a cycle high. The American worker is in great shape because the labor market is tight, and inflation is low. Consumption growth should be strong in 2019 if this Goldilocks situation stays in place.
Have comments? Join the conversation on Twitter.
Disclaimer: The content on this site is for general informational and entertainment purposes only and should not be construed as financial advice. You agree that any decision you make will be based upon an independent investigation by a certified professional. Please read full disclaimer and privacy policy before reading any of our content.


