UPFINA's Mission: The pursuit of truth in finance and economics to form an unbiased view of current events in order to understand human action, its causes and effects. Read about us and our mission here.
Reading Time: 4 minutes
There are quite a few stats showing U.S. large cap stocks have gone up too far too fast. When that happens over a long enough period, stocks start to get expensive. That’s what has happened according to FactSet, as of January 10th, the S&P 500 had a forward PE of 18.4 which is above its 5 year average of 16.7. The CNN fear and greed index is at 91 which is extreme greed. It hasn’t been at extreme greed this long in at least the past 3 years. According to Deutsche Bank, the weighted average Z-score for positioning and flows is in the 96th percentile. According to Bespoke Invest, nearly 100% of the time in the past 50 days the S&P 500 has been overbought.
As you can see from the chart below, the 5 day, 10 day, and 25 day moving averages of the put to call ratio are in the 5th percentile which is a sell signal that has gone off 12 times in the past 4 years. The average change in the following 3 months is -5.5% and stocks fell every time.
The signal went off once in December 2017 and then many times in January 2018. Giving more credence to this indicator, the reverse of this, which is the put to call ratio in the 95th percentile, correctly called rallies 9 out of 10 times with an average gain of 9.2% in the next 3 months.
Economists Are Cautious
As we mentioned in an article late last year, Wall Street was very cautious about 2020 returns. That’s because unlike last year, in 2020 the stock market started off fully valued. Stocks aren’t in a bubble, but you’d have to predict a bubble to be very bullish for the year. That’s why very few analysts were bold enough to call for average returns of about 10% this year. With such solid returns at the start of January and such low projections, the stock market could reach many full year projections in the first month. Usually, when stocks start the year off well, they have a good year. In the 35 times the S&P 500 started the year off up 0.65% or more in the first 5 days (up 0.69% in 2020), it was up 31 times with an average full year gain of 17.2%.
It’s interesting to juxtapose recent gains with 2020 price targets. It’s also interesting to see how well stocks have done compared to the weak expectations for 2020 from economists. As you can see from the chart below, the consensus for 2020 GDP growth heading into the year was the lowest of this expansion.
Expectations ending 2019 were where estimates usually end up after the year in question takes place. Growth was expected to be 1.8% in 2020. It doesn’t even have to be that strong to do better than expectations similar to 2018. Obviously, 2018 had the benefit of the tax cut. This year has the benefit of low expectations and global monetary stimulus. We can never know what investors are pricing in, but with the high forward PE multiple, it seems to suggest investors don’t see 1.8% GDP growth coming. They’d probably be disappointed with such a weak year unless this is mindless euphoria with no regards for economic growth.
Will The Consumer Drive Growth?
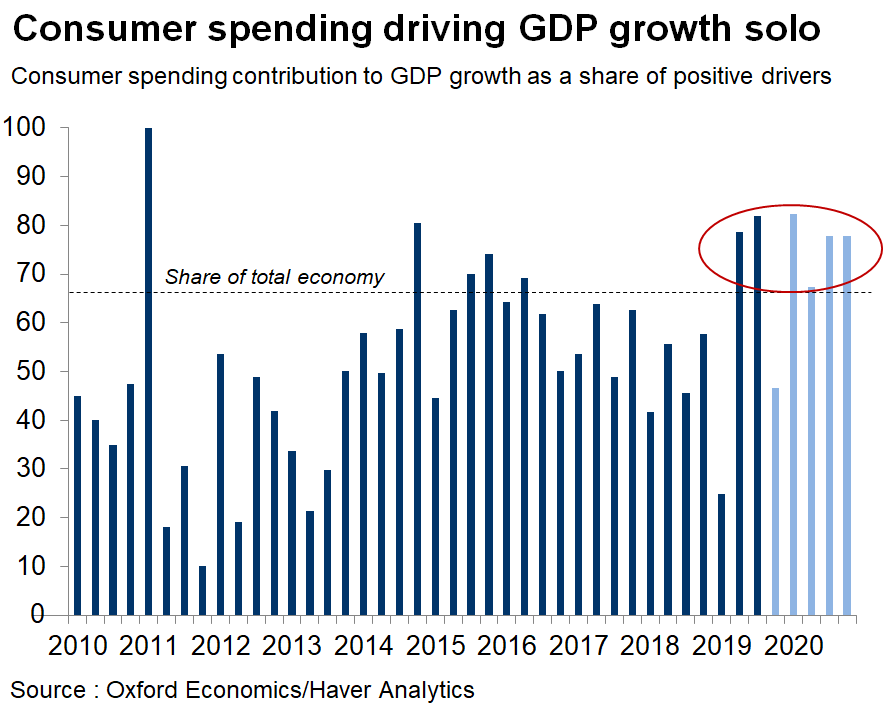
Currently Oxford Economics sees 2020 GDP growth mostly being driven by consumer spending as you can see from the chart below.

While that’s not an impossible projection, one must wonder how consumers will deal with the recently rising headline CPI and the declining average weekly wage growth. That’s not a recipe for a strong consumer. On the other hand, the stock market is helping upper income consumer sentiment. The Bloomberg consumer comport index hit a 19 year high in the first week of 2020. The consumer might be off to a great start this year.
Q4 GDP Growth & ECRI Growth
Q4 U.S. GDP growth won’t be as bad as it was initially feared to be, but much of the growth will come from trade. The average estimate is for 2.1% growth. The Atlanta Fed Nowcast calls for 2.3% growth, but implied in its estimate is 2.3% real PCE growth and -2.7% real gross private domestic investment growth. That’s not good, especially the latter. The NY Fed Nowcast, which was the most accurate forecaster of Q3 growth, expects only 1.11% growth. Its Q1 2020 Nowcast only sees 1.24% growth. Finally, the St. Louis Fed Nowcast sees 1.83% Q4 growth. It’s usually optimistic, but not this quarter.
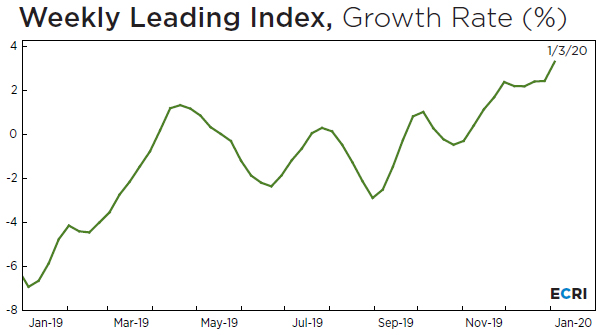
It’s interesting that the Economic Cycle Research Institute continues to discuss the cycle downturn, while its own leading index is doing well. In the week of January 3rd, its index rose 0.7 to 148.7 which was its highest reading since June 15th, 2018. Its growth rate increased 0.9% to 3.3% which is the highest rate since May 18th, 2018. Maybe stocks are right about growth accelerating.
Q4 Earnings Season
This earnings season looks good. 73 S&P 500 firms have issued negative guidance, which is 2 below the 5 year average, and 34 firms have issued positive guidance, which is 2 above the 5 year average. This better than average quarter is because of tech. 19 tech firms have issued negative guidance which is 1 below the 5 year average; 20 issued positive guidance which is 6 above the 5 year average and the most since Q2 2018. It’s tied for 2nd place since FactSet started tracking this in 2006. Furthermore, tech EPS estimates are the only ones that haven’t fallen since the end of September as growth is expected to be -1.8%. S&P 500 earnings are expected to fall 2%.
According to The Earnings Scout, 25 firms have reported Q4 earnings as of Tuesday morning. 84% beat EPS estimates on -0.64% growth and 68% beat sales estimates on 3.01% growth. Aggregate earnings are down 8.34% as EPS growth is being helped by buybacks.
Conclusion
Stocks are overbought and have gotten expensive even though estimates call for just 1.8% 2020 GDP growth. The consumer will be hurt if real wage growth continues to fall. On the positive side, the ECRI leading index’s yearly growth rate is breaking out and 20 tech firms have issued positive EPS guidance.
Have comments? Join the conversation on Twitter.
Disclaimer: The content on this site is for general informational and entertainment purposes only and should not be construed as financial advice. You agree that any decision you make will be based upon an independent investigation by a certified professional. Please read full disclaimer and privacy policy before reading any of our content.


