UPFINA's Mission: The pursuit of truth in finance and economics to form an unbiased view of current events in order to understand human action, its causes and effects. Read about us and our mission here.
Reading Time: 4 minutes
Both core and headline monthly CPI fell 0.1% and missed estimates by 0.1%. Core CPI was 0.1% and headline CPI was 0.2%. On a yearly basis, headline CPI increased 0.2% to 2.3% which met estimates. Core CPI stayed at 2.3% which also met estimates. Headline CPI increased because of the rise in energy inflation. This was the first time headline CPI was above core CPI since October 2018.
We deflate wage growth by headline CPI, so this rise is bad for workers. The Fed looks at core inflation to set monetary policy which means there’s a slightly lower chance of a Fed rate hike this year, not that there was a legitimate chance of one anyway. There’s currently a 4.7% chance of a hike this year. Specifically, headline CPI increased from 2.05% to 2.29% which is the highest level since October 2018. Core CPI fell from 2.32% to 2.26% which wis the lowest level since June 2019.
Let’s now look at the breakdown of this report. There are 3 takeaways from this report. 1) Energy inflation drove headline inflation. 2) Shelter inflation was modestly weaker. 3) Healthcare inflation increased and was strong.
Energy inflation was 3.4% which increased from -0.6%. That was the highest reading since October 2018. The 2 year growth stack was up 1.2%. Within the category, gas prices were up 7.9% and fuel oil was up 4.6%. It’s interesting that energy inflation will face easy comps in the next few months, but oil will face tougher comps. In other words, in February and March oil could be down from last year, but energy inflation could be relatively high. Food inflation was 1.8% which was down from 2%. It was driven higher by the tight labor market as food away from home inflation was 3.1%. Food at home inflation, which is based on commodities, was just 0.7%.
Rent Cancels Out Healthcare
Core services inflation was 3%. It was driven by medical care services inflation which stayed at 5.1% (an expansion high) and shelter inflation which fell 0.1% to 3.2% which was the lowest reading since January 2019. Shelter inflation is the largest component of the report. Its decline explains why core CPI fell. Transportation services inflation was 0.6%. Interestingly, new vehicles had 0.1% inflation and used cars & trucks had inflation of -0.7%.
Medical care inflation was high. Medical care commodities inflation spiked from 0.6% to 2.5%. As you can see from the chart below, health insurance inflation was 20.4%.
It’s possible the BLS report put too much of the medical care inflation in insurance residuals and not enough in other categories, but either way healthcare inflation is strong and rising. Overall medical care inflation was up from 4.24% to 4.57% which was the highest rate since September 2016.
Shelter inflation’s modest decline canceled out the strength in medical care costs. Remember, this data is all based on rent surveys. Shelter inflation fell from 3.32% to 3.25%. Owner’s equivalent rent inflation rose 2 basis points to 3.28% and primary rent inflation rose 3 basis points to 3.69%. However, lodging away from home inflation fell from 3.26% to -0.28%. It’s only 1% of CPI though.
As you can see from the chart below, the 3 month annualized inflation rate for primary rent and owner’s equivalent rent have cratered in the past few months. They are now at 2.55% and 2.69%.
Without rent prices increasing at a quicker rate, core inflation won’t rise. Once medical care inflation starts facing tougher comps in July, shelter inflation will need to pick up to keep core CPI above 2%.
What This Report Means For Consumers And The Fed
This report is bad for consumers and doesn’t mean much for Fed policy. Specifically, in the past 2 months CPI has increased 52 basis points mainly because of the rise in energy inflation. In that same period, production and non-supervisory wage growth fell 59 basis points. That’s quite the negative turnaround for the real pay growth of 80% of workers. Headline CPI was 2.29% and non-supervisory wage growth was 3.03%; at least real wage growth stayed positive. The situation looks worse for all workers. Average weekly wage growth for all workers was 2.27% which is below December’s CPI reading.
The rise in healthcare and energy prices isn’t great for low income consumers, but they will at least get a boost from the minimum wage hikes in 2020. As you can see from the chart below, retail spending growth excluding autos and gas was the quickest for low income workers and the weakest for high income earners. That’s despite the rise in equity prices which help the rich.
Interestingly, in the first 2 weeks of 2020, Redbook retail sales growth was 6.1% and 5%. The consumer looks to have started off the year on solid footing.
This CPI report doesn’t mean much for the Fed because it will only raise rates if inflation stays high. Falling core CPI certainly won’t do anything to get us closer to a hike. Core CPI has been above 2% for 7 months, but core PCE hasn’t gotten to the Fed’s 2% target since September 2018. If anything, the Fed is much more likely to cut rates because inflation is low than raise rates because inflation is high. There is a 57.6% chance the Fed cuts rates in 2020.
Inflation Predictions
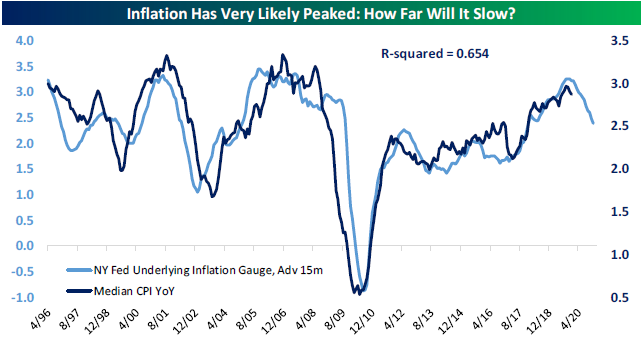
Let’s take a quick look at 2 inflation predictions. As you can see from the chart below, the NY Fed’s underlying inflation gauge advanced 15 months has a 65.4% R squared with median yearly CPI. That implies median CPI will fall because the underlying inflation gauge has been falling.
On the other hand, the weakening yearly change in the trade weighted dollar could cause upward pressure on commodities prices. If inflation were to increase in the first half of 2020, the Fed wouldn’t hike rates. If it were to fall, the Fed could cut rates, but it depends on other factors.
Conclusion
Energy prices boosted headline inflation, while shelter inflation dragged down core CPI despite the rise in medical care costs. This CPI report doesn’t mean much for Fed policy, but it does mean real wage growth fell. It has fallen significantly for production and non-supervisory workers and is negative when looking at weekly pay. The NY Fed underlying inflation gauge suggests median inflation could fall and the weak trade weighted dollar suggests yearly commodities price growth could rise.
Have comments? Join the conversation on Twitter.
Disclaimer: The content on this site is for general informational and entertainment purposes only and should not be construed as financial advice. You agree that any decision you make will be based upon an independent investigation by a certified professional. Please read full disclaimer and privacy policy before reading any of our content.


