UPFINA's Mission: The pursuit of truth in finance and economics to form an unbiased view of current events in order to understand human action, its causes and effects. Read about us and our mission here.
Reading Time: 4 minutes
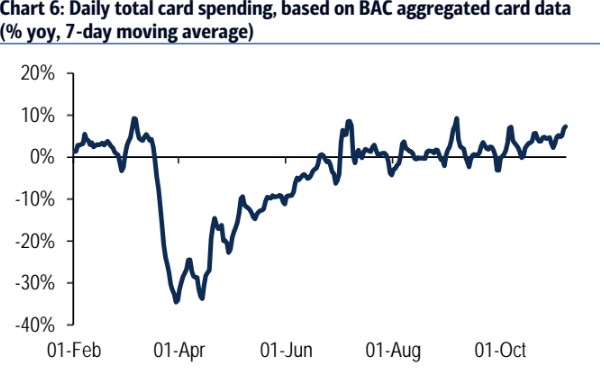
The Bank of America card spending data directly opposes the Chase card spending data. As you can see in the chart below, the 7 day moving average of spending growth increased slightly. It has been range bound for a few months, but this latest movement matters because so many see a slowdown.
A slowdown in spending is almost inevitable, but the more resilient the consumer is, the easier it will be for it to bounce back next year. We know this holiday shopping season won’t be good. We just want to know how bad it will be. So far, we’ve only seen the labor market improve at a lesser pace (looking at the BLS report). It hasn’t had outright declines yet.
We say it’s almost inevitable that consumer spending will weaken in the next few weeks because economic restrictions are coming and people are going to be more careful as the virus spreads and more people die. The latest news is the Minnesota governor ordered restaurants and bars to halt in person dining and fitness centers for 4 weeks. Furthermore, the 3% positivity rate caused NYC schools to shut down.
Across The Board Retail Sales Miss
The October retail sales report wasn’t terrible, but each category missed monthly growth estimates and each had a negative revision (in September’s data). Headline monthly sales growth was 0.3% which missed estimates for 0.4%. Last month’s reading was revised down from 1.9% to 1.6%. The comp was easier, yet growth still missed expectations. Excluding vehicles, monthly sales growth was 0.2% which missed estimates for 0.5% growth. September’s growth was revised down from 1.5% to 1.2%. Control group sales growth was 0.2% which missed estimates for 0.4%. Last month’s growth was revised down from 1.5% to 1%.
As you can see from the chart above, non-store monthly spending growth was the strongest as it was 3.1%. The new normal remained in place. On the opposite side, clothing and accessories spending growth was -4.2% as people aren’t gathering in groups so they don’t need to spend as much on new clothes. Spending on sports, hobbies, books, and music fell over 4% monthly as many outdoor activities ceased due to the colder weather. Outdoor activities spending was stronger than normal in the summer because they are great for social distancing. Therefore, the drop may have been bigger than the seasonal adjustment accounts for.
Total retail sales are up 4.9% from February. Online sales are up 27.9% and restaurant/bar sales are down 14.9%. Think about how much worse restaurant and bar sales will be in November with some states limiting dining. Plus, outdoor dining is tough with the colder weather. Yearly retail sales growth excluding food services fell from 8.8% to 8.5%. Total retail sales growth fell from 5.9% to 5.7%. Adding in food services suppressed growth obviously. As you can see from the chart below, yearly control group sales growth fell slightly to 10.8%, making this the 2nd best reading ever.
Yearly food services and drinking sales growth was -14.2%. It only got 4 basis points better. If October’s colder weather and more COVID-19 cases were a problem, November is going to be much worse. Monthly sales growth was -0.13%. Sporting goods sales growth was -4.15%. Motor vehicles and parts showed 40 basis points of monthly growth and 10.7% yearly growth which was down 21 basis points sequentially. This is the largest category as it is 20.77% of spending. Car sales will slow when public transportation becomes fully safe again.
Better Than Expected Industrial Production
In September, retail sales beat estimates and industrial production missed estimates. In October, it was the opposite. September’s industrial production figures were revised higher and October’s growth beat estimates. Monthly industrial production growth was revised up from -0.6% to -0.4%. October’s growth was 1.1% which beat estimates by 0.1%.
September monthly manufacturing growth was revised up from -0.3% to 0.1%. October’s growth beat estimates by 0.1% as it was 1%. As you can see from the chart below, the percentage of manufacturing industries in a recession is off the peak, but is still high. 86% of sub-sectors were in a recession in October; the 3 month average is 78%. The capacity to utilization rate rose from 72% to 72.8%.
Yearly manufacturing growth rose from -5.1% to -3.6%. Yearly industrial production growth rose from -6.7% to -5.3%. Manufacturing was led by aerospace, metals, printing, and paper. Aerospace should improve as the economy reopens and flying recovers. Mining was down 0.6% because of oil and gas. Yearly mining production growth fell from -18.8% to -19.3%. This cycle’s bottom was the lowest since the data started being calculated in 1920. That means this decline was a 1 in 100 year event.
Utilities production was up 3.9% because of electricity demand. Industrial production and manufacturing are 5.6% and 5% below where they were before the recession. This cyclical upturn isn’t close to running its course. There will probably be a bump higher in the spring when the vaccines get fully distributed.
NY Fed Quarterly Update
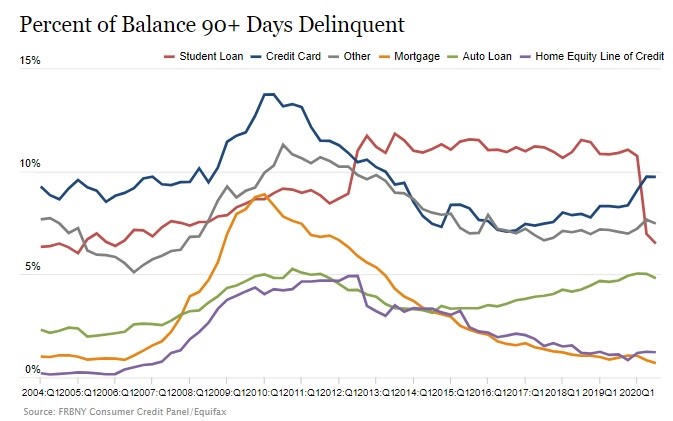
The NY Fed’s Q3 quarterly household debt and credit report was released this week. The chart below shows the 90+ day delinquency rate in each of the major loan categories.
Student loan delinquencies fell from 7% to 6.5%. Credit card delinquencies fell one tenth to 9.7%. Auto loans even fell from 5% to 4.8%. Mortgage loans fell one tenth to 0.7%. Housing debt went into forbearance. Forbearance rates have been falling consistently as homeowners aren’t in trouble. There is no issue with the housing market. Banks worry about hotel industry loans, not residential housing loans.
Conclusion
The Bank of America card spending data looks better than the Chase data. We don’t know for sure how November did, but we know there was some moderate weakness in October and restaurant sales growth will be hit by COVID-19 yet again. The industrial production report beat estimates, but we are still way off record production. There are probably a few quarters left of growth before the cycle peaks. This is a manufacturing cyclical upturn. The consumer had a lower rate of delinquencies within mortgages, auto loans, student debt, and credit card debt.
Have comments? Join the conversation on Twitter.
Disclaimer: The content on this site is for general informational and entertainment purposes only and should not be construed as financial advice. You agree that any decision you make will be based upon an independent investigation by a certified professional. Please read full disclaimer and privacy policy before reading any of our content.


