UPFINA's Mission: The pursuit of truth in finance and economics to form an unbiased view of current events in order to understand human action, its causes and effects. Read about us and our mission here.
Reading Time: 5 minutes
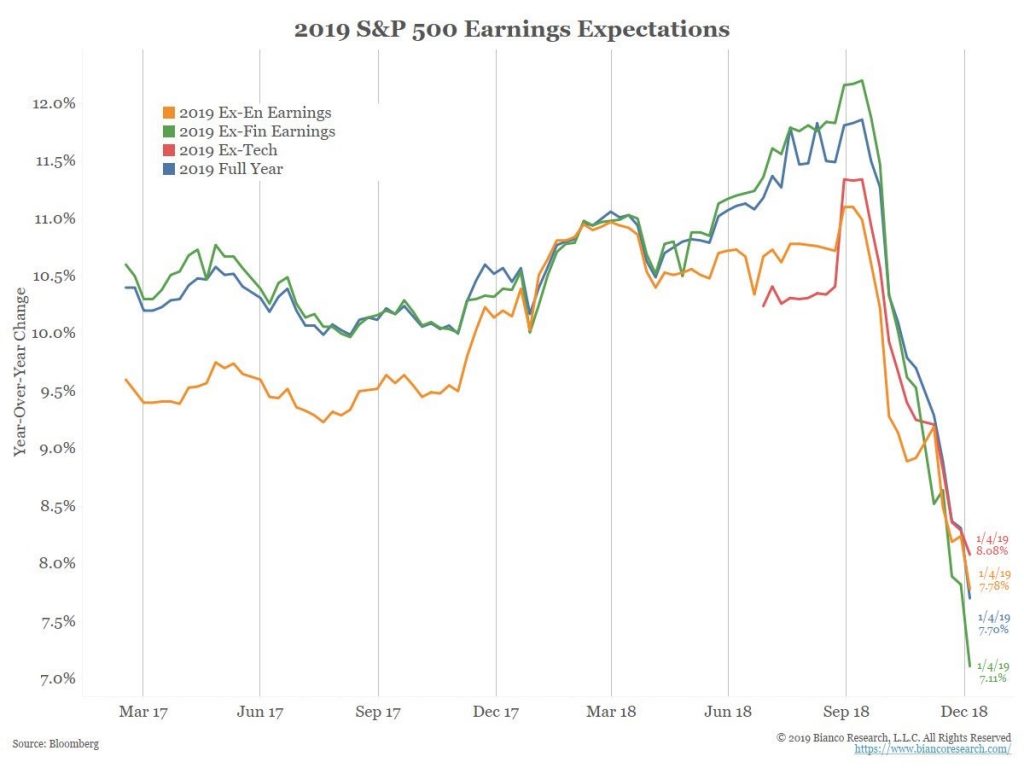
The rate of change of future earnings estimates tells us where stocks are headed. As you can see from the chart below, the decline of 2019 estimates coincided with the 20% correction in the S&P 500.

Estimates cratered whether you exclude energy, financials, or tech. The ex-tech segment started at the lowest growth rate and ended at the highest growth rate which shows us tech was a major reason overall estimates fell as tech growth was revised lower. We have anecdotally seen this already with Apple’s negative earnings pre-announcement which was catalyzed by weakness in China.
Q4 EPS growth is still expected to be 10.51%, but Q1 2019 earnings growth is expected to be 5.02%. That’s a decline from 6.26% on December 1st. These estimate declines are either going to make it easier for firms to beat estimates or are an accurate representation of the current economic slowdown. The first few firms to report Q4 results haven’t indicated positive momentum. 67% of the 18 S&P 500 firms that have reported Q4 earnings have seen their Q1 estimates cut afterwards. The average cut has been 5.29%. Last quarter only 59% of firms had estimates cut; they were only cut by 0.35%.
The obvious negative news is the rate of change in earnings estimates. The good news is if S&P 500 earnings growth is in the mid-single digits, it doesn’t justify a bear market unless investors are pricing in a recession next year. Stocks already fell in 2018 on very high earnings growth which shrunk multiples sharply. If stocks were to fall on mid-single digit earnings growth, multiples would be very low.
FAAMG Is Everything
As we mentioned, the tech stocks have seen sharper negative 2019 earnings estimate revisions. The top internet firms control most of the S&P 500’s sales growth. (To be clear, not all these firms are in the tech sector. They are in communication services and consumer discretionary as well.)
As you can see from the table below, Facebook, Apple, Amazon, Microsoft, and Google had 19% sales growth in 2017. Without those firms, the S&P 500 only had 5% sales growth.

The expectation is for 20% and 15% sales growth for the FAAMG names in 2018 and 2019. If these firms falter, the overall market’s sales growth will too as excluding FAAMG, S&P 500 sales growth is only expected to be 4% in both years. As you can see from the table on the right, their 2018 net margins of 19% are much higher than the S&P 500 ex-FAAMG’s net margins which are 10%. The worry is increased regulations can hurt these major internet firms’ margins. Some say regulations help the big players, but fines certainly don’t help.
The Cyclicals Are Cheap
Stocks declining in late 2018 lowered multiples. Furthermore, as the chart below shows, cyclicals are cheaper than the overall market than at any time since at least 1980.

There are a few interesting facets to this discussion. Firstly, cyclicals being this cheap implies traders are extremely fearful of a recession. That might not be fair yet because the economic data isn’t recessionary. Keep in mind when viewing this chart that the data in 2008 is immaterial because earnings were suppressed sharply by the recession; multiples made no sense then.
Secondly, cyclicals are a buy when they are expensive and a sell when they are cheap. This is because at the peak of the cycle earnings are high, and at the trough of the cycle earnings are low. It’s best to come up with a normalized PE when valuing cyclicals for the long run. Forward earnings estimates are useless at the top and bottom of the cycle.
Thirdly, as we mentioned the S&P 500’s multiple shrunk in 2018 because of the strong earnings growth and the decline in prices. This means cyclicals were aggressively sold to become cheaper than the overall market. Cyclicals will snap back if the economic data improves.
Solid But Disappointing Non-Manufacturing ISM
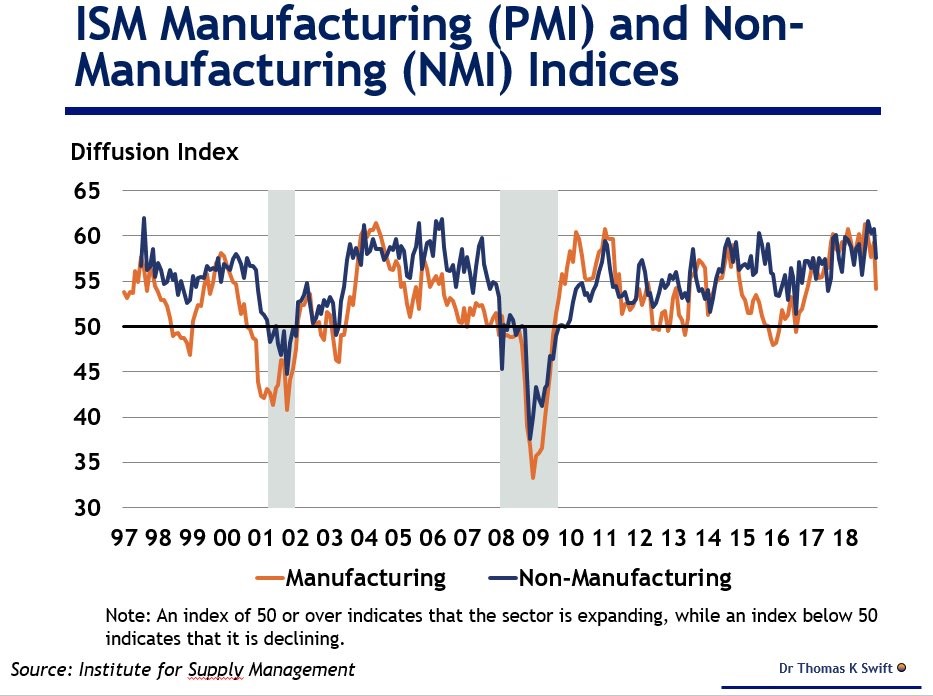
Just like earnings estimates, the December ISM non-manufacturing PMI showed growth, but weakened. This is evidence of a slowdown, not a recession. As you can see from the chart below, the manufacturing ISM weakened more than services probably because the global economy is seeing weakness; manufacturing is more internationally focused.

One example of global weakness is the 1.9% decline in industrial output in Germany in November. The odds of a German GDP contraction when industrial output falls are 80%.
The non-manufacturing ISM PMI was 57.6. On the negative side, this fell from 60.7 and missed estimates for 58.4. On the positive side, this is only the weakest report since July and is still consistent with 3.2% GDP growth. That’s better than the median CNBC estimate for 2.9% Q4 GDP growth. Business activity fell 5.3 points to 59.9. However, new orders were up 0.2 to 62.7. New orders don’t rise in a recession. The prices paid index fell 6.7 points to 57.6 because of the drop in commodities prices. In this report a retail trade firm stated, “Business is very good. Strong demand and pipeline.” Retailers had a solid holiday shopping season.
Small Business Optimism
Since the economy is slowing and the NFIB small business survey is biased towards Republicans and the Democrats won the House, it’s no surprise that the December small business index fell. The decline was slight which we consider good news. As you can see in the chart below, it fell from 104.8 to 104.4 which beat estimates for 104.

The biggest weak point in the report was the 6% decline in the net expectations for the economy to improve in the next 6 months to 16%. The best part of the report was the 6% increase in the net plans to increase inventories to 8%.
Conclusion
Earnings estimates, the non-manufacturing PMI, and the small business index are all weak in rate of change terms, but not signaling a recession is coming soon. Cyclicals may have fallen too much relative to the overall market since they are by far the cheapest since 1980. The FAAMG stocks drive sales growth. This makes the negative guidance Apple put out particularly daunting.
Have comments? Join the conversation on Twitter.
Disclaimer: The content on this site is for general informational and entertainment purposes only and should not be construed as financial advice. You agree that any decision you make will be based upon an independent investigation by a certified professional. Please read full disclaimer and privacy policy before reading any of our content.


