UPFINA's Mission: The pursuit of truth in finance and economics to form an unbiased view of current events in order to understand human action, its causes and effects. Read about us and our mission here.
Reading Time: 4 minutes
Redbook same store sales growth gives us the most updated data on consumer spending. Getting the latest data is important because the September tariffs on consumer goods are now in effect. If you were expecting a major decline in the first week of September, you will be disappointed because in the week of September 7th yearly same store sales growth fell from 6.5% to 6.4% which is a great reading. Same store sales growth has been strong in the past 3 readings. Keep in mind, we are still awaiting the government’s August retail sales report. We’re most interested in how the control group does because it has been incredibly strong in the past couple of months. Let’s see if the University of Michigan survey’s decline in consumer confidence is correlated with a drop in spending.
Areas Of Weakness In Solid Small Business Confidence Index
The August NFIB small business optimism index had a modest decline in August, but there were some underlying weaknesses which are concerning. The headline index fell from 104.7 to 103.1 which missed estimates for 103.5. The biggest sequential weakness was the 8 point drop (to 12%) in the net percentage of firms expecting the economy to improve. This is likely because of the trade war. It’s not necessarily a big problem for small businesses to become less positive on the economy. Actual sales, hiring, and profits as well expectations for those results matter more. We’re not looking for macro analysis from small businesses.
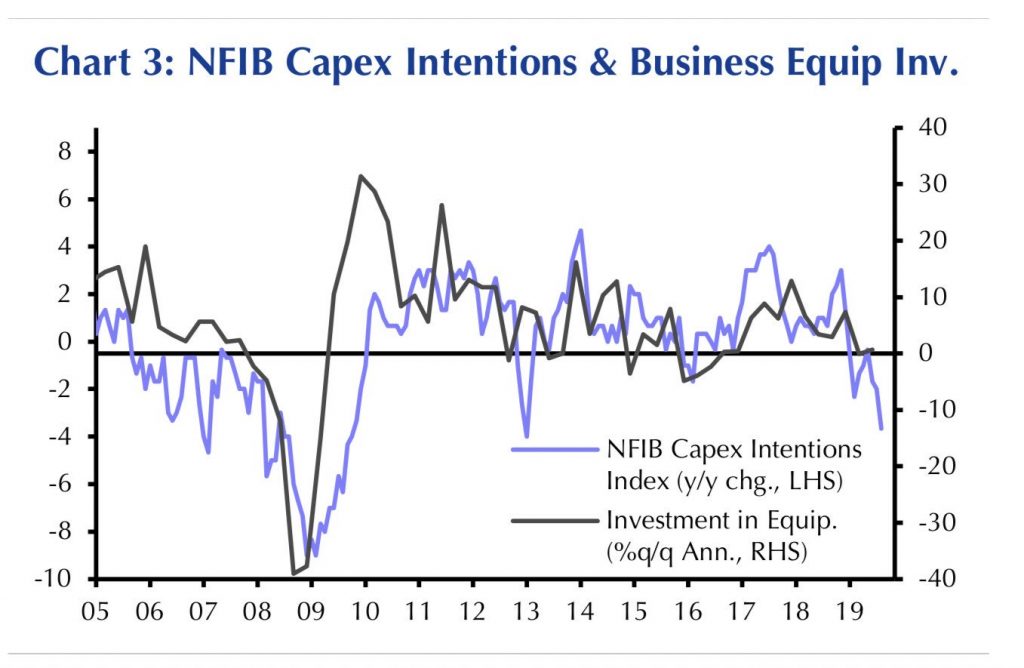
That category’s decline was responsible for 50% of the index’s drop. The weakness in other categories was more worrisome though. The expectation for real sales to increase fell 5 points to 17%. Those with current job openings fell 4 points to 35%. As you can see from the chart below, the yearly change in small businesses’ capex intentions is correlated with business equipment investment growth.
The recent decline in yearly capex intentions implies business equipment investment will fall. That being said, the plans to make capital expenditures increased 1 point to 28% in August. Yearly growth was weak because the comparison got tougher by 3 points. The index measuring actual capex in the past 6 months increased from 57 to 59 which is up from 56 last year.
The best part of this report was the 3 point increase in earnings trends to -1%. Expected credit conditions improved 2 points to -2%. Those who think the Fed shouldn’t be cutting rates are using this to support their argument. However, if the Fed didn’t cut in July and guide for further cuts, there would be tighter credit conditions. Tightening conditions, a global slowdown, and a trade war is a recipe for a sharp slowdown in activity.
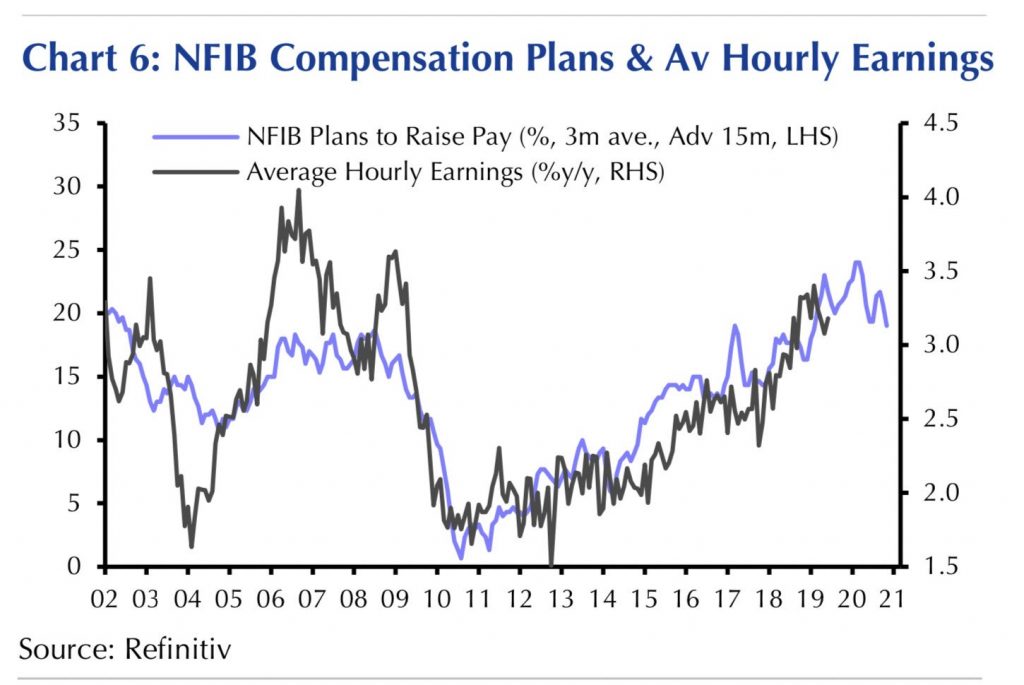
As you can see from the chart below, the 3 month moving average of plans to increase pay is correlated with average hourly earnings growth lagged 15 months. That means any decreases in hiring plans will show up in hourly wage growth next year.
The chart shows the 3 month average decreased. The index actually increased from 17 to 19, but the reading of 24 was lapped out of the average causing it to fall. Wage growth was the best part of the August BLS report and is driving the consumer. It would be a problem if wage growth were to fall in 2020.
Great July JOLTS Report
July job openings fell from 7.248 million to 7.217 million. Plus, June’s reading as revised lower by 100,000. However, despite this weakness, it was actually a good reading. The JOLTS report was good because hiring increased from 5.716 million to 5.953 million which is the 2nd highest reading ever (highest was in April). We’ve seen the gap between openings and hires increase in the past few years making openings less relevant.
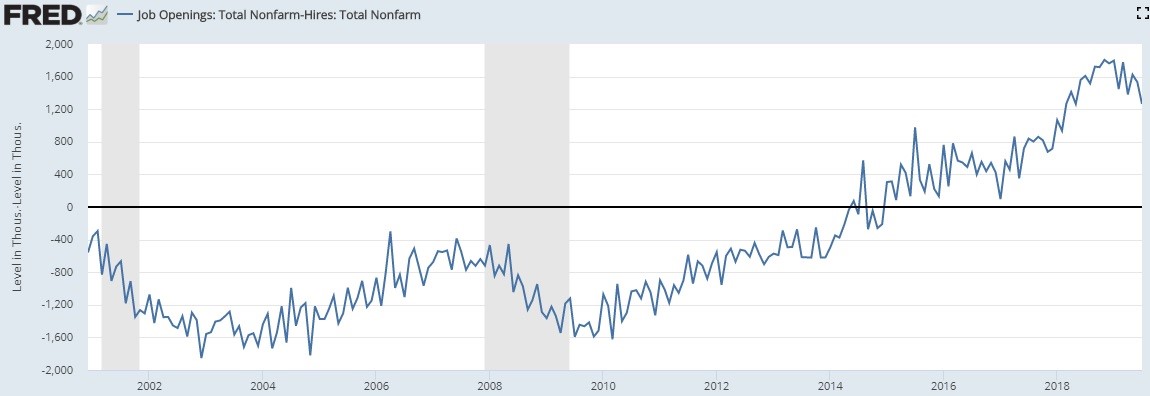
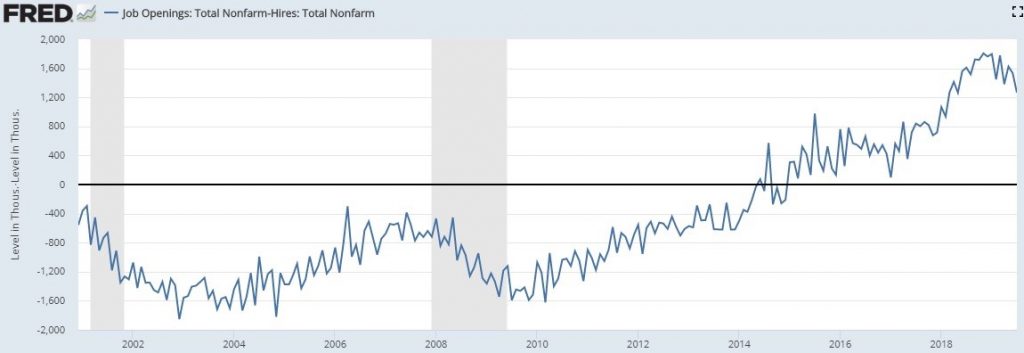
There’s no benefit to the economy if companies have job openings, but never hire workers to fill these positions. This report lowered the spread between openings and hires to 1.264 million which is the lowest since May 2018 as you can see from the chart below. We’ve seen this gap fall in the past 2 recessions, but that occurred when hiring fell. There won’t be a recession if hiring is strong. The gap in the past few years has been unprecedented. It should shrink.
As you can see from the bottom chart below, yearly hiring growth improved from -2% to 2.1%.
There have been some negative yearly growth readings without any issues forming. It’s best to avoid any semiannual declines as those have only occurred during or near recessions. Growth was 1.6% in 1H 2019. Hiring growth in July was driven by the professional and business segment as yearly growth went from -8.3% to 4.2%. There was also a burst in hiring in healthcare and social assistance which hit a record high. Remember, the August BLS report showed healthcare job creation was actually below its 1 year average. Yearly hiring growth improved from -2.5% to 9.5%. That’s the best growth since January 2017.
Further supporting the narrative that this was a very good JOLTS report is that quits increased from 2.3% to 2.4% which is a cycle high. As you can see from the chart below, that’s 0.1% below the record high in January 2001. This means workers see opportunity elsewhere.
Switching jobs leads to higher wage growth. Accommodation and food services had the highest quits rate as it increased from 4.9% to 5%. That’s actually not close to the record high of 6.3% in January 2001, but it is a cycle high. The private quits rate of 2.6% is 0.2% below the record high.
Conclusion
The tariffs haven’t hurt consumer spending yet. Small businesses are still optimistic although their excitement about the future economy has waned considerably because of the trade war. The 6 month outlook for general business conditions was the lowest since March. The July JOLTS report was actually good despite the weakness in job openings. Hiring and quits were strong. There is no indication of a recession here. This report supports the thesis that strength in consumer spending will continue.
Have comments? Join the conversation on Twitter.
Disclaimer: The content on this site is for general informational and entertainment purposes only and should not be construed as financial advice. You agree that any decision you make will be based upon an independent investigation by a certified professional. Please read full disclaimer and privacy policy before reading any of our content.


