UPFINA's Mission: The pursuit of truth in finance and economics to form an unbiased view of current events in order to understand human action, its causes and effects. Read about us and our mission here.
Reading Time: 4 minutes
Changes to weekly aggregate hours worked includes the changes to the length of the workweek and the growth in payrolls. It gives a more detailed picture of the changes to the labor market than headline job creation.
We touched on changes to aggregate hours worked in our previous article. Let’s delve deeper. For manufacturing, in August aggregate hours growth was 0.5% on a monthly basis which was a big improvement partially because it had a very easy comparison. On a yearly basis, growth wasn’t as great as it improved from -0.3% to 0.1%. Growth was even worse for production and non-supervisory workers as it improved from -0.9% to -0.8%. July’s reading was the weakest of this cycle. Manufacturing is the only sector where we have data on overtime. For all manufacturing employees, overtime hours worked per week fell from 3.3 to 3.2 hours which is the lowest since April 2017. For production and nonsupervisory workers, hours stayed at 4.2.
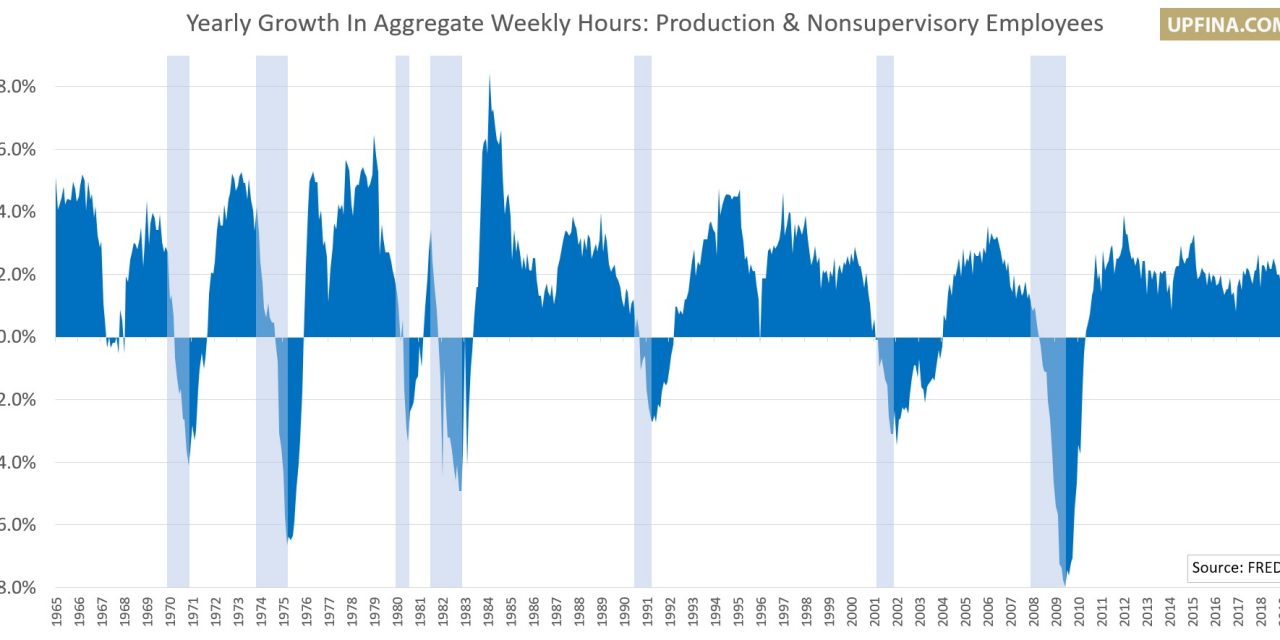
Now let’s look at the overall private sector. Aggregate yearly hours worked growth improved from 1.1% to 1.2%. July’s reading was a few basis points from the cycle low. The chart below shows yearly growth in private sector aggregate weekly hours worked for production and nonsupervisory workers. This growth rate improved from 0.7% to 0.8%.
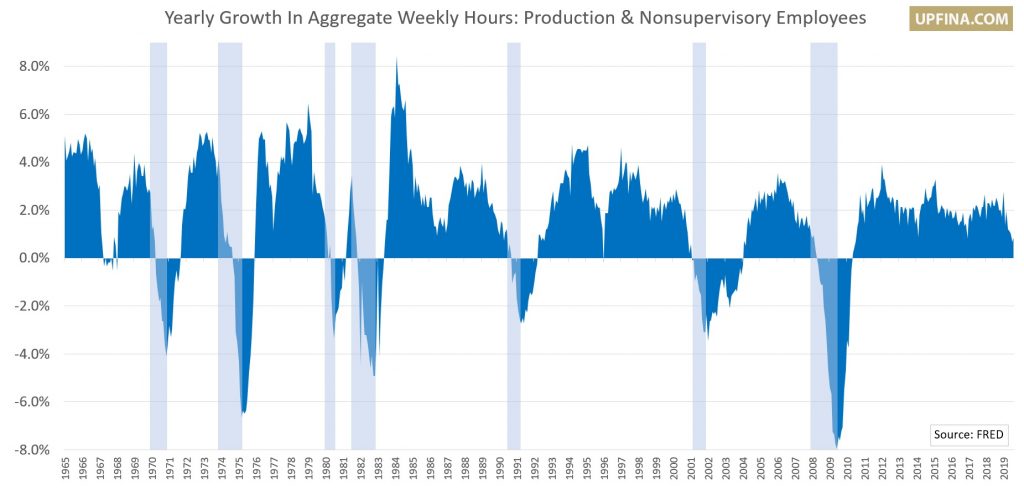
July’s reading was the lowest of the cycle. As the recession bars indicate, there is usually a recession soon after growth gets this low. The notable exception was in 1967.
That’s not to say production and nonsupervisory workers are doing terribly. They had hourly wage growth of 3.5% in August which is tied for the cycle high. Overall wage growth was 3.2%. Real wage growth should be solid for both categories if headline CPI hits expectations of 1.8%.
US Sector PMI
It’s no surprise there was weakness in the US Markit sector PMI since there was weakness in the composite PMI. As you can see from the chart below, the industrial output index was barely above 50 as it had its lowest reading since April 2016.
The healthcare industry had a slowdown in business growth which is in tune with the weakness in the BLS report. In August, there were only 24,000 healthcare jobs added which is below the 12 month average of 33,000. In the Markit report, the healthcare industry expanded at the lowest rate since December 2017.
The best part of this report was the growth in technology and consumer goods. With real wage growth so solid, it’s no surprise consumer spending growth is strong. Both had the fastest growth in 4 months. Tech was the strongest and consumer goods was second. The financial sector was the worst as it was the only one with an index below 50. That was the first sub-50 reading since January. This sector doesn’t like low yields and a flat/inverted curve.
Sequential Global Weakness Driven By Services
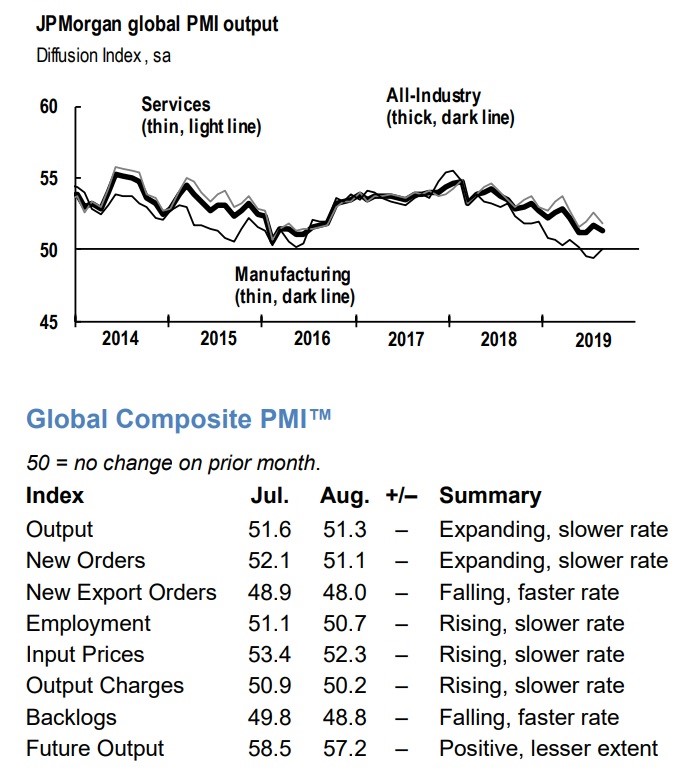
Now let’s look at global PMI data. Similar to the US, the global service sector PMI played catch up with the weakness in manufacturing. The slowdown is spreading and can’t only be blamed on trade now. The global services PMI fell from 52.5 to 51.8 in August which was a 3 month low and one of the worst readings in the past 3 years. Global service sector business sentiment was the worst since the calculation started in October 2009. The future activity index fell from 58.9 to 57.4. The new business index fell from 53.2 to 51.9 which signals the lowest growth rate in over 3 years.
Manufacturing actually fell at a slower rate as its PMI improved from 49.3 to 49.5. This is the longest streak of contraction since 2012. Since services is larger than manufacturing, the composite index fell from 51.6 to 51.3 which is the 3rd lowest reading (by 0.1) in the past 3 years as you can see in the chart below.
German Economic Weakness
Now let’s look at the German economy which had weakness in manufacturing and construction and modest strength in services. Its manufacturing PMI improved from 43.2 to 43.5. July’s reading was a 7 year low, so this is far from a great report. Output fell for the 7th straight month. The pace of manufacturing job cuts hit the fastest rate since July 2012. The construction PMI was a disaster as it fell from 49.5 to 46.3 which was the worst reading since June 2014. Commercial activity fell the most since March 2013. New orders fell for the 4th straight month and at the quickest rate since July 2014.
You get the idea as to why the 2020 estimate for German GDP growth has fallen this year from 1.5% to 0.9% as the chart below shows.
Even in the services sector which saw its PMI increase from 54.5 to 54.8, sentiment hit the lowest level since October 2014.
Fiscal Policy To Provide Less Of A Bounce
The chart below is interesting because it shows how the economy typically works versus the last couple years.
Usually, there is a stimulus towards the end of recessions and right after them because governments are late to the game. That’s why there wasn’t much stimulus in 2008, but there was a lot from 2009 to 2010. The Recovery Act acted as a drag on the economy as it was accelerating out of the recession from 2011-2012. 2018 and 2019 included oddly timed smaller stimuli. The expansion didn’t require a tax cut and spending bump. 2020 won’t have as large of a benefit. However, if there is a trade deal in late 2019 or early 2020, there should be a short-term improvement in economic activity similar to a stimulus.
Conclusion
Aggregate hours worked growth is mostly weak for manufacturing, production and nonsupervisory workers, and the entire private sector. Usually, such weakness occurs before a recession. It’s no surprise the industrial sector PMI was weak and consumer goods was strong. Tech was the strongest and financials were the weakest. The decline in the global composite PMI from July to August was actually driven by the service sector. Estimates for 2020 German GDP growth have cratered this year because of weak data such as the contractionary readings from manufacturing and construction. The Trump tax cut won’t help growth as much in 2020, but the trade deal could act as a short-term stimulus, if it happens soon.
Have comments? Join the conversation on Twitter.
Disclaimer: The content on this site is for general informational and entertainment purposes only and should not be construed as financial advice. You agree that any decision you make will be based upon an independent investigation by a certified professional. Please read full disclaimer and privacy policy before reading any of our content.


