UPFINA's Mission: The pursuit of truth in finance and economics to form an unbiased view of current events in order to understand human action, its causes and effects. Read about us and our mission here.
Reading Time: 4 minutes
The backdrop of the August PPI report is treasury yields have been rising quickly this week and the Fed is about to cut rates. Yields are still historically low, but if the selloff in treasuries is to continue, we will need to see a pickup in inflation. The Fed would rather PPI be modest because it is about to cut rates in September, but ultimately the Fed follows PCE inflation the closest, so an increase in PPI won’t be a deal breaker for coming rate cuts. The Fed is hoping for a trade deal. If a deal is made soon and it improves business/consumer sentiment, the Fed can easily be done with rate cuts this fall.
Because of the recent rise in rates at the short end of the curve, there has been a modest decline in rate cut expectations with the most likely decision being 2 more cuts this year. The odd situation as far as how the Fed affects the yield curve is that a few months ago before the curve inverted, the bulls were begging the Fed to cut rates to steepen the curve, but now a steepening after an inversion would be a recession signal, based on past cycles. However, it’s also important to point out that the inversion in the yield curve was primarily driven by different factors unlike previous cycles, so this relationship may not necessarily hold this cycle. As we discussed previously, on average in the past 7 inversions, the short end of the curve has increased above the long end. Now it’s the opposite as the long end fell below the short end. Dovish guidance at the September meeting would steepen the curve. The bulls are trying to avoid what they wanted a few months ago.
PPI Inflation Increases
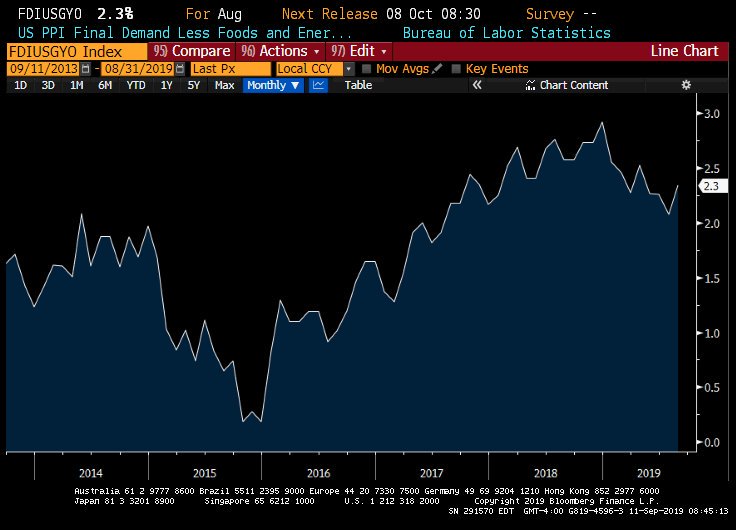
With those aspects in mind, this was a modestly strong PPI report as all categories of inflation increased from July. Headline PPI increased from 1.7% to 1.8% which met estimates. As you can see from the chart below, core inflation increased from 2.1% to 2.3% which beat estimates by 0.1%.
Finally, core inflation excluding transportation services increased from 1.7% to 1.9%. This report could imply coming strength in future inflation readings since producers face price pressures first.
Some wonder why inflation isn’t stronger given the tariffs are supposed to increase prices. As Oxford Economics predicted earlier in the year, demand declines are overcoming price increases which is making for a continuation of modest inflation. While the chart shows core PPI is higher than at most points in the past few years, it has fallen from its peak at the start of the year despite there being more tariffs. Tariffs increase prices in the goods they affect. Inflation isn’t high because the PCE inflation rate on all goods not being taxed is negative.
Is Sentiment Declining?
It’s tough to write articles with the dynamics of the trade war changing quickly. We will just briefly touch on the latest news. The US and China will be meeting in October (supposedly). China decided not to tax a handful of American goods including cancer drugs, lubricants, pesticides, and shrimp meal as an olive branch to smooth relations. In turn, the US admin delayed the tax increase on $250 billion worth of goods set to go into effect on October 1st by 2 weeks (until the 15th). These are both very small changes, but they indicate the momentum is in favor of some sort of compromise.
We described the latest news on the trade war because the trade war has been hurting consumer sentiment. The working theory on the divergence between the University of Michigan survey and the Conference Board survey is the former is correlated with stocks and the latter is correlated with the labor market. Therefore, it makes sense the former fell in August with stocks and the latter followed the strength in wage growth and the low jobless claims. The chart below suggests the Conference Board survey will weaken. It has a high correlation with TR/Ipsos PSCI which has recently fallen.
The September Conference Board survey comes out on September 24th. If this occurs, it means the tariffs are overcoming the labor market as a driver of this index.
The Consumer Gives Confusing Ratings On The Economy
The weakness in sentiment correlates perfectly with the reading that 60% of Americans see a recession in the next year as somewhat likely or very likely. That also relates to the increase in Google searches for the term “recession.” However, this exact survey shows 56% of Americans view the economy as excellent or good.
It’s ironic that the consumer sees a recession because strong consumer spending growth is what is keeping the economy out of a recession. High expectations for a recession are likely related to the yield curve inversion and the positive viewpoint of the current economy is likely due to strong wage growth. Despite the yield curve being a relatively complex topic for everyday Americans, it went mainstream. The good news is consumers will still keep spending if wage growth is strong. There is no reflexivity here.
Complete Analysis Of The ISM Gap
We touched on the gap between the ISM services PMI and the ISM manufacturing PMI when the services PMI came out. We mentioned it’s not a good sign for manufacturing to crater much more than services. In the August reports, the manufacturing PMI was consistent with 1.8% GDP growth and the services PMI was consistent with 2.7% growth. There was a 7.3 point gap between the two. The graphics below show a complete statistical overview of what has historically occurred in this situation.
On average since 1998 whenever the services PMI has been 6 or more points above the manufacturing PMI, the services PMI has fallen 2.13 points in the next 6 months. Such a drop wouldn’t be recessionary, but would be consistent with a slowdown. This prediction makes sense because the range of Q3 GDP growth estimates is from 1.7% to 2.7%. The services PMI was high.
Small Caps Rally While Earnings Estimates Crater
It’s interesting that small cap earnings estimates are cratering as the group is rallying significantly. The chart below shows S&P 600 earnings estimates declining to negative yearly growth.
From August 27th to September 11th, the S&P 600 increased 8.91%. The rally has been driven by the banks which are enjoying the selloff in treasuries. The KBW regional bank ETF increased 11.7% in that period.
Conclusion
Bullish investors shouldn’t want the curve to normalize as steepening after inversions has been correlated with recessions in past cycles. The Fed might not cut rates after September if there is a trade deal. The trade war and yield curve inversion may be why Americans see a recession occurring soon. However, they still think the current economy is fine as they are spending money. The services PMI might fall if past results are indicative of future performance. Oddly, small caps have done very well just as their earnings estimates have plummeted.
Have comments? Join the conversation on Twitter.
Disclaimer: The content on this site is for general informational and entertainment purposes only and should not be construed as financial advice. You agree that any decision you make will be based upon an independent investigation by a certified professional. Please read full disclaimer and privacy policy before reading any of our content.


