UPFINA's Mission: The pursuit of truth in finance and economics to form an unbiased view of current events in order to understand human action, its causes and effects. Read about us and our mission here.
Reading Time: 5 minutes
Cash is outperforming stocks and bonds in 2018 for the first time since 1992. Gone are the days of no corrections and low volatility. In fact, we discussed this almost exactly one year ago, that the probability of 2017 style low volatility repeating in 2018 was very low. Rates are rising, growth stocks are starting to underperform value stocks, and the housing market is weakening. The housing market is different from last cycle in that there weren’t exotic mortgages issued. There are still issues with the housing market as we discussed here, but not at the level that could catalyze a crisis like 2008. The similarity of the housing market today with 2008 is that consumers think prices aren’t affordable. Weakness in the housing market won’t crater the economy, but it is one more negative catalyst which adds to the other issues such as the fiscal stimulus losing its positive effect and the hawkish Fed. The housing and real estate surprise index has the lowest z-score since the calculation began in 2000. The data was obviously worse during the financial crisis, but the z score of the surprises is now worse.
Housing Market Index Down 13% YoY
The most recent example of a big negative surprise in the housing industry is the housing market index. This is a survey, so it isn’t hard data. However, in the past few months the soft data has been too optimistic. The soft and hard data appear to be re-coupling. The sentiment shift is in concert with the correction in the stock market. As you can see from the chart below, the index hit an 18 year high of 74 in December 2017.
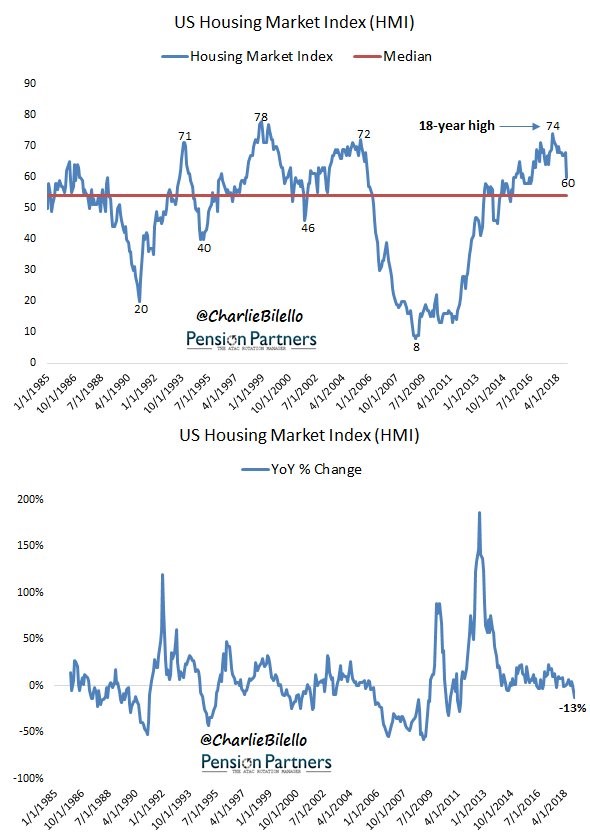
Source: Twitter @CharlieBilello
In the last 3 cycles, the average peak was 73.6. Generally, when this index hits a high number in the 70s and then declines, it signals the cycle is over. That thesis is supported by the lack of home affordability even as wage growth is strong.
The November housing market index was 60 which missed estimates and the prior reading which was 68. The low end of the expected range was 66. Either this report is a one-off event or it’s a signal of a larger trend. Since we’ve seen a lot of data showing housing is weakening, this data seems like an extension of the recent trend. It will cause analysts to lower their 2019 growth forecasts. Goldman Sachs has recently become relatively bearish on growth as it only expects GDP to grow at a 1.75% pace by the end of 2019.
The housing market index was down 13% year over year which is the biggest year over year decline since 2011. The only good news from this report is the ITB home builders ETF rose 6 basis points on a day the S&P 500 fell 1.66%. While economists missed the mark, traders expected this weak reading. This is why some macro investors use stocks as a signaling tool. Using home builder stocks as a signal won’t help you figure out where they are going, but it could help you figure out when the overall economic weakness will be priced into the other sectors of the stock market.
Weak Housing Traffic, Current Sales, & Future Sales
Since the overall housing market index fell to its weakest point since August 2016, it’s no surprise the individual components were all weak. As you can see from the chart below, the traffic index fell sharply from 53 to 45, marking the lowest reading since August 2016.
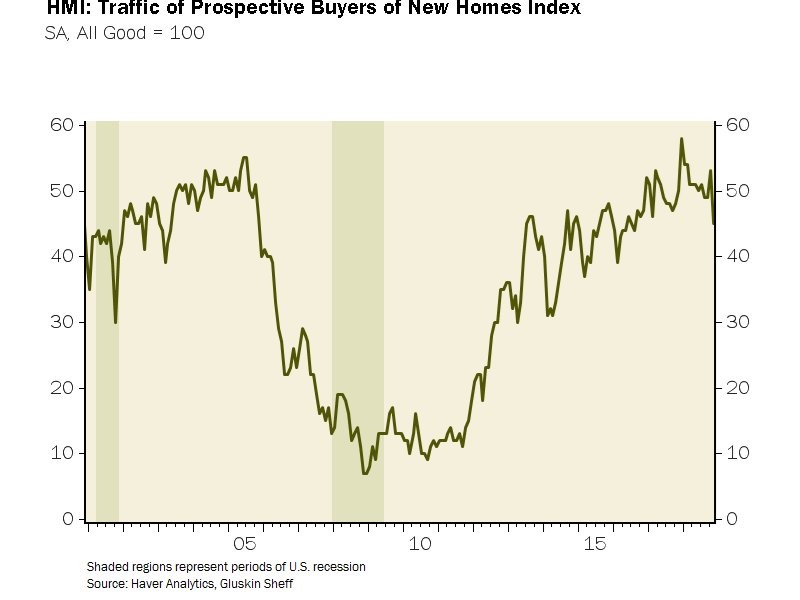
Source: Haver Analytics
On a year over year basis, this was the largest decline in traffic since February 2014. The current sales index fell 7 points to 67 which is also the worst reading since August 2016. Finally, the worst component was the future sales index which fell 10 points to 65 which was the worst reading since May 2016. Usually, in sentiment surveys, future estimates are highly correlated with current results. However, it’s bad for future expectations to underperform current results.
Weakness In Sacramento
Since real estate is local, we like to include data from various cities to show how the overall trend looks from a micro perspective. The Sacramento housing market isn’t like the hottest markets such as Denver and Seattle since it hasn’t regained its previous cycle peak. Even New York, which hasn’t been hot this cycle, has beaten its previous peak. The Sacramento all-transaction home price index in Q2 2018 is at 279.01. It peaked at 292.32 in Q5 2005. On a year over year basis, the index was up 8.6%.
Even though there wasn’t a bubble in all housing markets this cycle, the latest data from October shows weakness. As you can see from the table below, single family home sales were down 4.8% year over year and median prices were only up 1.4%.
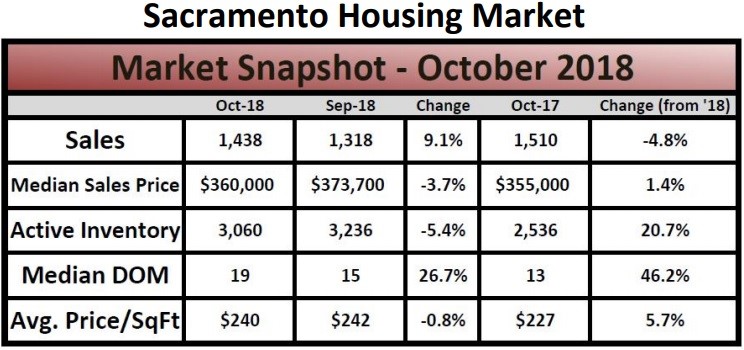
On a month over month basis, prices fell 3.7%. Active inventory increased 20.7% which signals prices could come down further.
Unusual Recession Indicator
The most common measurement of the yield curve is the 10 year yield minus the 2 year yield. The current differential is 26 basis points which is low, but still normal. This means a recession shouldn’t be on the near term horizon. However, in a recent article we showed that a positive yield curve could be a recession indicator this cycle. The chart below shows the 1 quarter average spread between the 10 year yield and the 3 month yield. This is paired with the 1 quarter average of the Fed funds rate. It gives a 1.85% chance of a recession in the next year.

Source: Political Calculations
However, some argue that the current rate hikes make a recession more likely than if rates were this low in the past because the neutral rate is lower. If this chart is correct and the neutral rate is much higher, the economy isn’t near a recession. If the neutral rate is lower this cycle than last cycle, it will take fewer hikes to slow the economy.
Global Curve Inversion
The chart below is a variation of a trend we’ve been discussing.
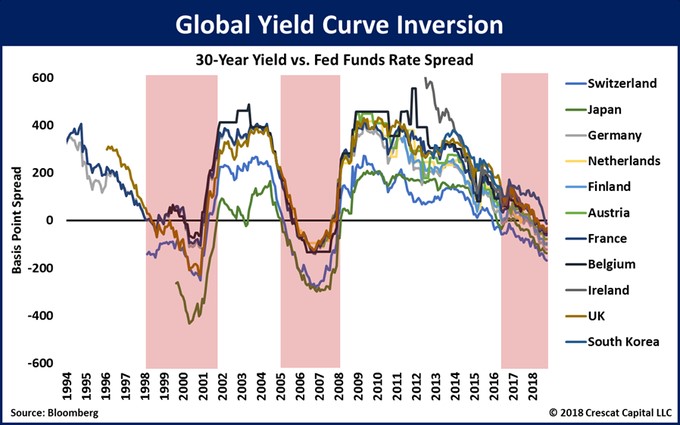
Source: Bloomberg
The Fed is much more hawkish than the ECB and BOJ. That is catalyzing the strong dollar and rising treasury yields. The chart above shows that the 30 year yields of 11 countries are below the Fed funds rate. There have been recessions after the prior two inversions. The caveat here is these comparisons aren’t apples to apples as the Fed funds rate is much lower than the U.S. 30 year treasury yield.
Conclusion
The housing market has been weakening. Not every single housing report is worthy of an article by itself, but it’s a big deal when a metric misses expectations by as much as the housing market index did. Rising interest rates are the straw that broke the camel’s back. If economic growth falls, which causes rates to fall and house price growth to slow, there might be a natural solution to this weakness. The problem is if there’s a recession, there will be much more violent price action to the downside. The Political Calculations chart of this article shows there’s little chance of a recession in the next year and the last Bloomberg chart shows there’s a high chance of a recession.
Have comments? Join the conversation on Twitter.
Disclaimer: The content on this site is for general informational and entertainment purposes only and should not be construed as financial advice. You agree that any decision you make will be based upon an independent investigation by a certified professional. Please read full disclaimer and privacy policy before reading any of our content.


