UPFINA's Mission: The pursuit of truth in finance and economics to form an unbiased view of current events in order to understand human action, its causes and effects. Read about us and our mission here.
Reading Time: 5 minutes
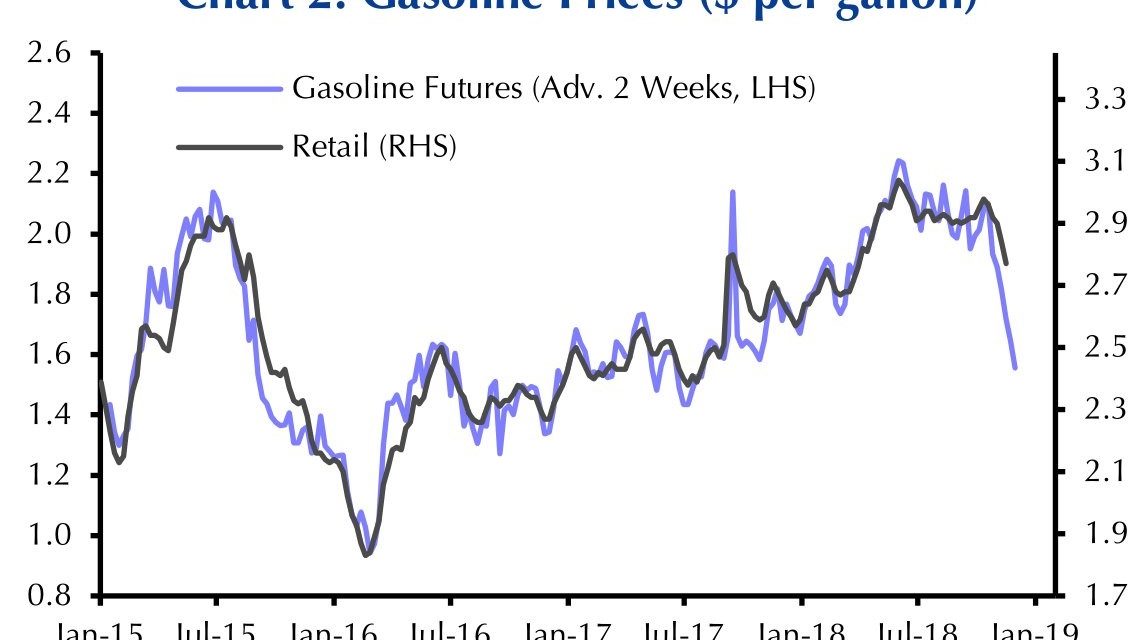
Oil has been cratering in the past few weeks which should be great for real wages deflated by headline CPI and retail sales this holiday season. As you can see from the chart below, gasoline futures imply the price at the gas station will fall sharply in the next 2 weeks.
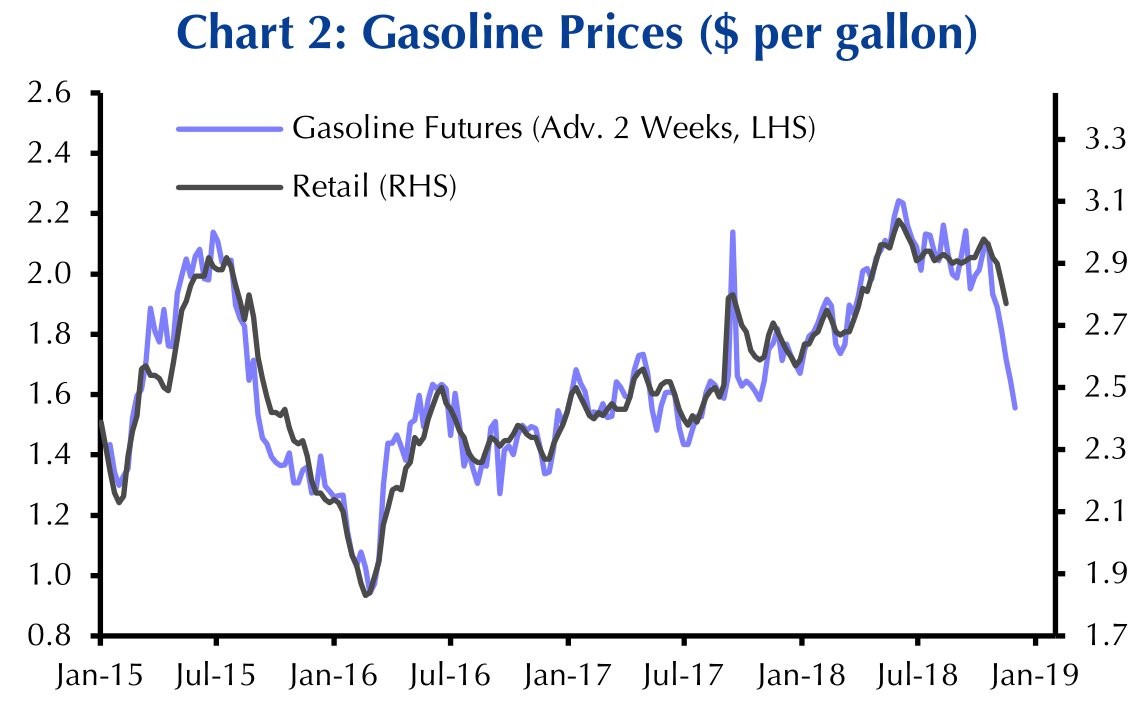
Source: Capital Economics
This will help low income people the most. Interestingly, many of the biggest retailers such as Target have cratered after their earnings reports despite this positive backdrop. This could be because this will be the last great holiday season this cycle. Some blamed Target stock’s decline on the increase in inventories which could force markdowns and declining margins if the products don’t sell through. Inventories were up 18%.
Is Target Representative of Entire Retail Sector?
Let’s look at Target’s earnings to understand why it sold off. Understanding sentiment helps us understand what economic weakness is being priced into the whole market. Q3 EPS was $1.09 which missed estimates by 3 cents. Revenue beat estimates for $17.8 billion, coming in at $17.82 billion. Same store sales growth was 5.1% which missed estimates for 5.2% growth. This is a rare quarter where EPS missed and revenue beat estimates. Gross margins fell from 29.6% to 28.7% as online orders increased supply chain costs. Same day delivery and rising wages hurt margins. The good news is the firm reiterated its strong guidance of 5% same store growth this holiday season.
It looks like investors are ignoring the great current results and even the solid guidance for holiday sales and instead worrying about 2019. It looks like CEO Brian Cornell called a near term top in his stock and the market when he stated in August this year that the economy was the best he’d ever seen. Target stock is down 22.66% since September and 21.2% in the past 8 trading days. He now claims there is “no sign” consumer spending is cooling off, but investors don’t believe him.
Consumer Spending Declines Are Delayed
While many leading indicators, such as the housing market, are showing a slowdown is here, consumer spending is still strong as the labor market is providing the best nominal wage growth of this cycle. Investors are concerned the decline in oil prices signals weak global growth, making it a negative even though it will help consumers and businesses. As you can see from the 3rd chart below, in the past 5 recessions, on average total consumption growth didn’t turn negative until after the recession started.
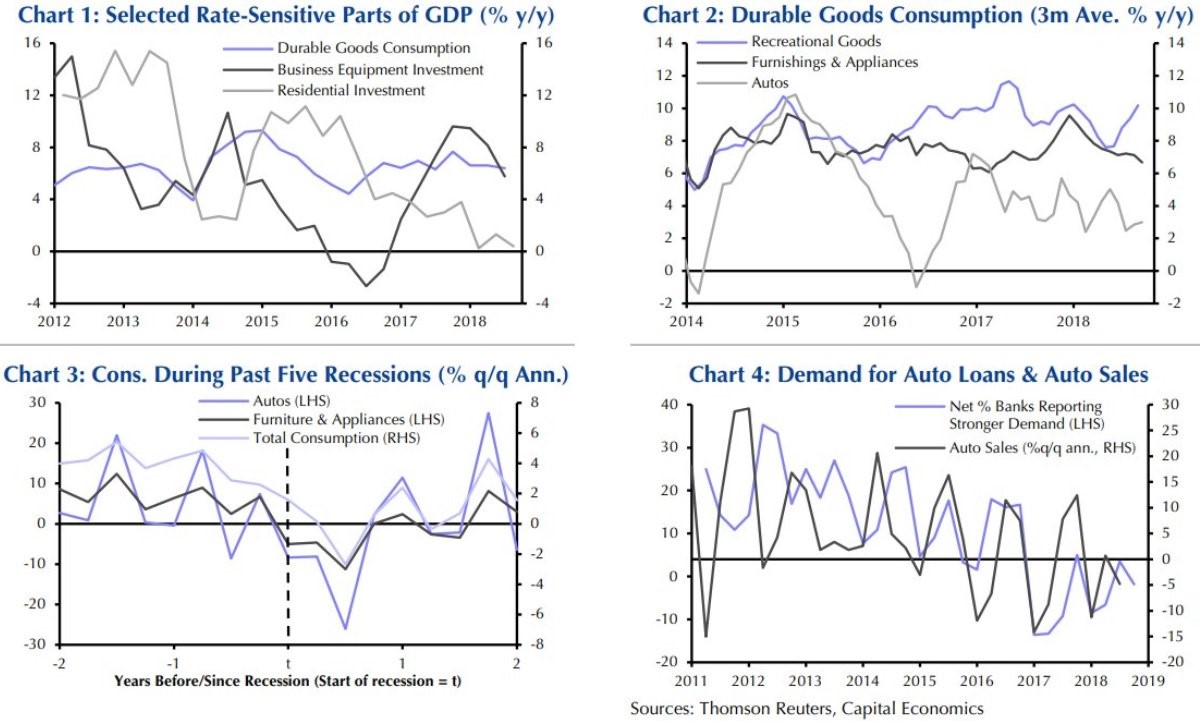
Source: Capital Economics
Since the slowdown started a few months ago, it’s wrong to state the positive retail sales growth means there aren’t issues with the economy. There clearly are issues with the economy as the first chart shows there hasn’t been much growth in residential investment this year. Business equipment investment growth is also slowing. The second chart shows growth in spending on furnishing and appliances and on autos has been slowing. Finally, the 4th chart shows banks aren’t seeing strong demand for auto loans.
Strong Industrial Production Growth
We don’t only show the negatives even though overall growth is slowing. The October industrial production report was positive as industrial production growth was 4.1% year over year and manufacturing growth was 2.7% year over year. Both hit a 10 year high. As you can see from the chart below, Emerging market industrial production growth is below US industrial production growth for the first time since the Asian crisis in 2002.
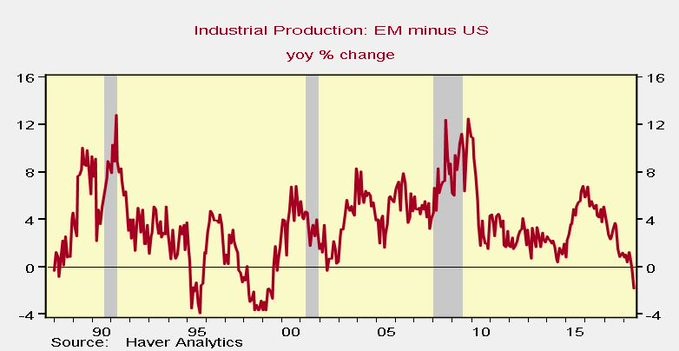
Source: Haver Analytics
This is a very rare feat. It supports the rally in the dollar which is partially why oil has been weak.
Let’s review the specifics of this solid report. Utility output fell 0.5% month over month because hurricane Michael caused 1.7 million power outages. It might increase in November because of the near record cold spell in the northeast. Utility production was only up 1.7% year over year. Mining volumes fell 0.3% month over month.
The good news is production for business equipment was up 0.8% monthly which could signal business investment in Q4 will regain strength from the weak Q3 reading. That would be a positive metric since overall growth is expected to slow. Construction supplies production was up 0.6% monthly as there is a material shortage. Strong construction demand doesn’t equate to a recession in the near term. The capacity to utilization rate fell from 78.5% to 78.4%. The cycle peak was 79.6% which means there’s still headroom for capacity to grow without reaching constraints.
The weakest part of this report was the 2.8% monthly decline in motor vehicle production which is in tune with the weakness we discussed earlier. High tech production growth was flat.
Will Oil’s Decline Hurt Industrial Production?
About 70% of industrial production growth was due to oil related line items this cycle, but some think the decline in oil won’t hurt industrial production as much as the last crash in late 2014 and 2015. Their reasoning is seen in the chart below where it shows mining and oilfield machinery as a percentage of nonresidential investment in equipment is lower than the peak in 2012.

Source: Haver Analytics
The chart below also suggests that the decline in oil won’t hurt the economy as much as the last decline.

Source: Haver Analytics
Mining capex as a percentage of total capex peaked at about 10% last cycle, while it is only at about 6% now.
Conclusion
Retail stocks are getting hammered even though real wage growth should be strong in November and consumer sentiment hasn’t taken a hit from the volatility in stocks. The retail ETF XRT is down 11.33% from November 8th to November 20th. Industrial production growth was strong in October. It may weaken a bit because of the crash in oil, but the economy won’t be hurt as much as it was hurt by the last crash in oil prices. Investment in the mining sector never reached the same levels where they peaked prior to the previous decline.
Have comments? Join the conversation on Twitter.
Disclaimer: The content on this site is for general informational and entertainment purposes only and should not be construed as financial advice. You agree that any decision you make will be based upon an independent investigation by a certified professional. Please read full disclaimer and privacy policy before reading any of our content.


