UPFINA's Mission: The pursuit of truth in finance and economics to form an unbiased view of current events in order to understand human action, its causes and effects. Read about us and our mission here.
Reading Time: 5 minutes
The spread between the 5 year treasury yield and the 2 year treasury yield inverted which sent financial markets into a frenzy as the S&P 500 fell 3.24% on Tuesday. The more popular 10 year/2 year spread is only 12 basis points away from inverting. Usually, when the curve inverts the difference between each part of the curve is small. This cycle could be different if the 10/2 year spread doesn’t invert soon. The more hawkish the Fed is, the more likely it inverts as well.
The yield curve is an interesting metric because it has a solid track record in America, and it is widely followed. There’s no way of measuring the prevalence of indexes, but every financial website covered it and the discussion dominated FinTwit. It’s possible that because we’re in the information age most successful indicators will be well known. This situation is interesting because some feel when a metric gains prominence, it loses all ability to make you profits.
Logically, it’s possible the yield curve inversion will cause volatility sooner than previous cycles because almost every investor is following it and views it bearishly. If an investor suffers from recency bias, he/she may believe the next recession will cause a 50% decline in stocks. If you think a 50% decline will occur in the next 1-2 years, you don’t care about profiting from the last few months of the bull market.
13.1 Months Until The Stock Market Peaks
The yield curve isn’t a silver bullet, but it gains veracity by the current economic slowdown. It’s one more support argument for a slowdown/recession rather than the only one to base your entire outlook on. The average lag time in the past 5 cycles from when the 10/2 year curve inverts until the next recession is 22 months. As of November, the Cleveland Fed’s recession indicator states there is a 20.3% chance of a recession in the next year.
The lag time until the stock market peaks is 13.1 months. Average returns are 21.8% after inversions. It’s important to avoid assuming this cycle will be average. In 1978, it took 0.8 months from the inversion to the S&P 500 peak and in 1998, it took 22.3 months. Like we mentioned earlier, many investors are willing to leave the 21.8% gain on the table to avoid a 50% loss. The problem with that logic is a 50% decline is far from a guarantee.
The chart below shows the 10 to 2 year spread in relation to 3 year S&P 500 returns since 1976.
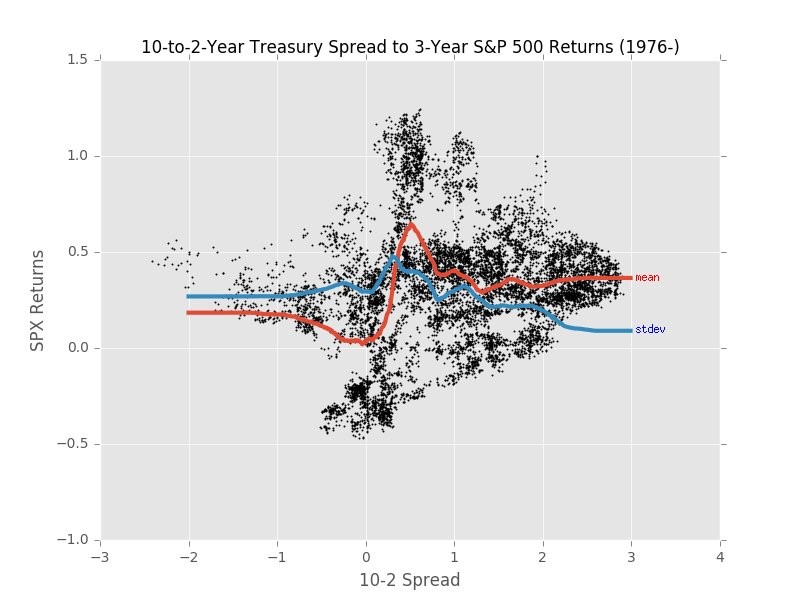
Source: SqueezeMetrics
There is a spike in volatility right before and after inversions. The steepening after inversions signals a recession, but it might be too late to sell stocks by then. It depends on your investment strategy. Some investors like to sell before peaks and some like to sell after peaks. There is no foolproof way to time the market.
Futures Market Starts To Price In Rate Cuts
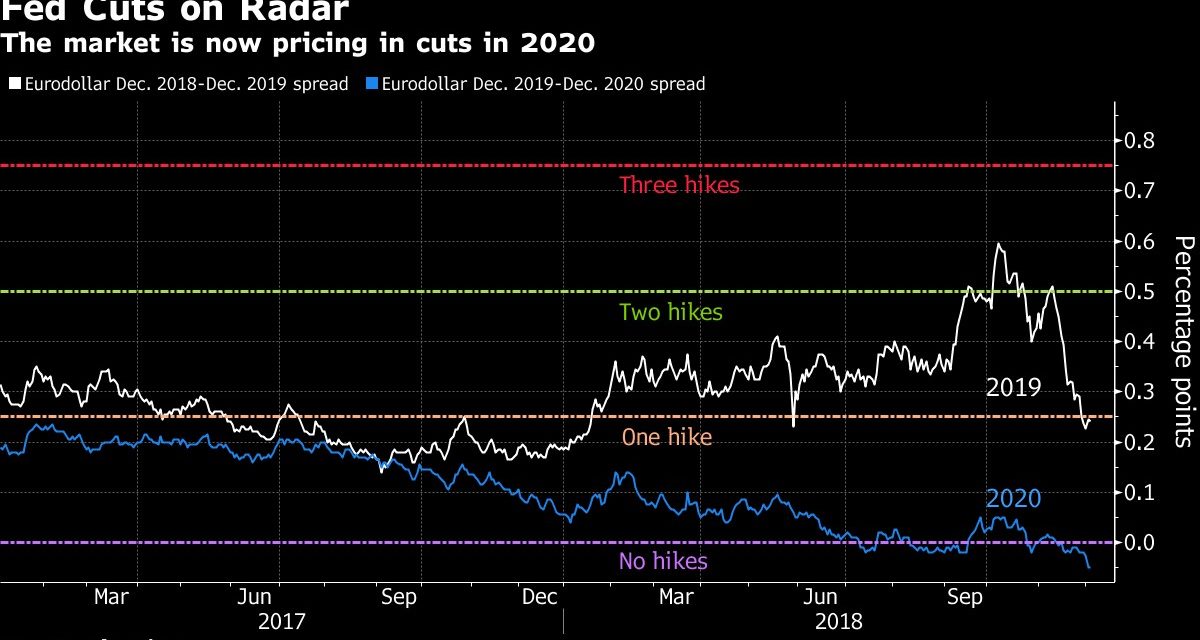
The December 19th Fed policy meeting is being focused on mostly because of potential changes to guidance. The hike is almost a certainty. There is a 78.4% chance of a hike according to the futures market. The Fed has been preparing the market for a hike in December through its speeches and Minutes for months. Backing out now, could be viewed as the Fed panicking. We’ve mentioned in a few articles that the market sees one hike in 2019 and the Fed sees 3. There’s an even more important divergence in 2020 as the Fed sees 1 more hike while the market sees a cut as the chart below shows.
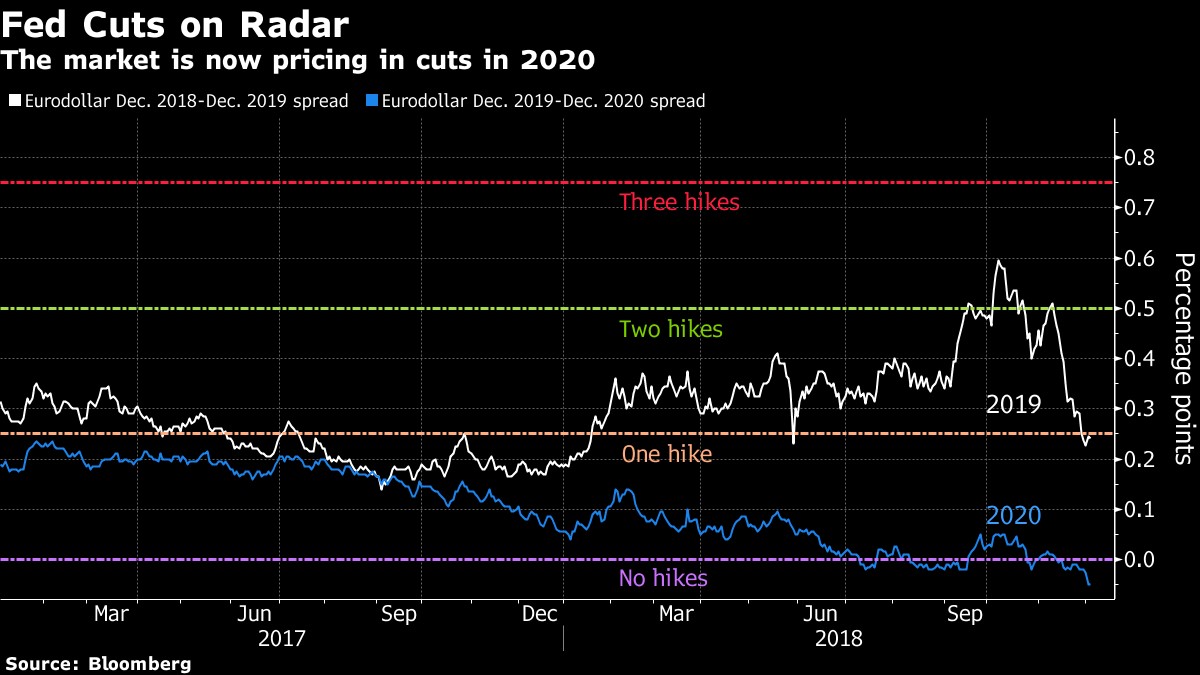
Source: Bloomberg
If the Fed were to cut rates in 2020, it would further support the thesis for an incoming recession. Cuts don’t cause recessions; they signal the economy is weak enough to need monetary support.
Historical Fed Quotes
Some analysts claim the Fed would never invert the yield curve because it portends a recession. That has been proven wrong in every cycle the curve has inverted since he Fed was created. With the latest decline in core PCE, the Fed could change its position and become dovish to extend the cycle. However, the Fed has a long history of ignoring inversions as you can see from the quotes of transcripts below.
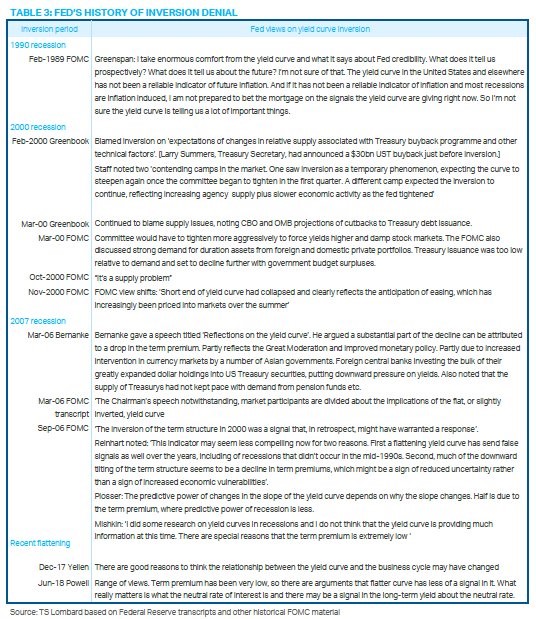
Source: TS Lombard
Powell stated the low term premium could mean the yield curve flatness doesn’t matter. With that mindset, the Fed will invert the curve because it thinks where the Fed funds rate is in relation to the neutral rate is more important that the treasury curve.
Even More Housing Weakness
Toll Brothers is a luxury home builder with a large presence in California. In its latest report, the CEO stated the housing market softened in November. That is in tune with the national results we’ve reviewed. As the chart below shows, there was a 13% decline in new orders in Q4 which was the weakest growth rate since 2010.
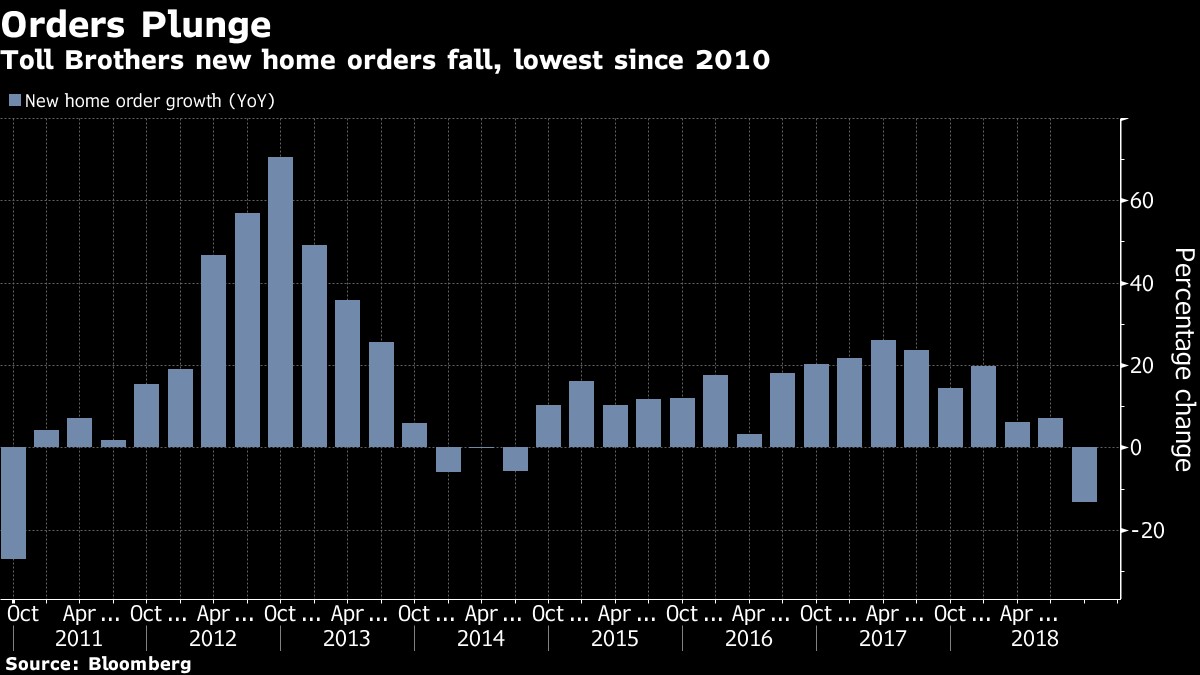
Source: Bloomberg
The consensus was for a 5% increase. The decline was 15% in dollar terms. Orders fell 39% in California.
Weak Construction Spending
In October, construction spending was up 4.9% year over year which is a sharp decline from the 7.2% growth rate in September. The growth rate was helped by private non-residential construction and hurt by private residential construction. Non-residential construction was up 6.4%, with office building construction up 10.3% and commercial subcomponent construction up 0.6%. As the chart below shows, residential construction spending was up 1.8%. Single family spending was up 2.4%, home improvements were up 0.4%, and multi-family spending was up 3.2%. This supports the trend of weakness in the housing market.
Big Negative Surprises
The housing market surprise index is showing its worst reading on record as you can see from the chart below.
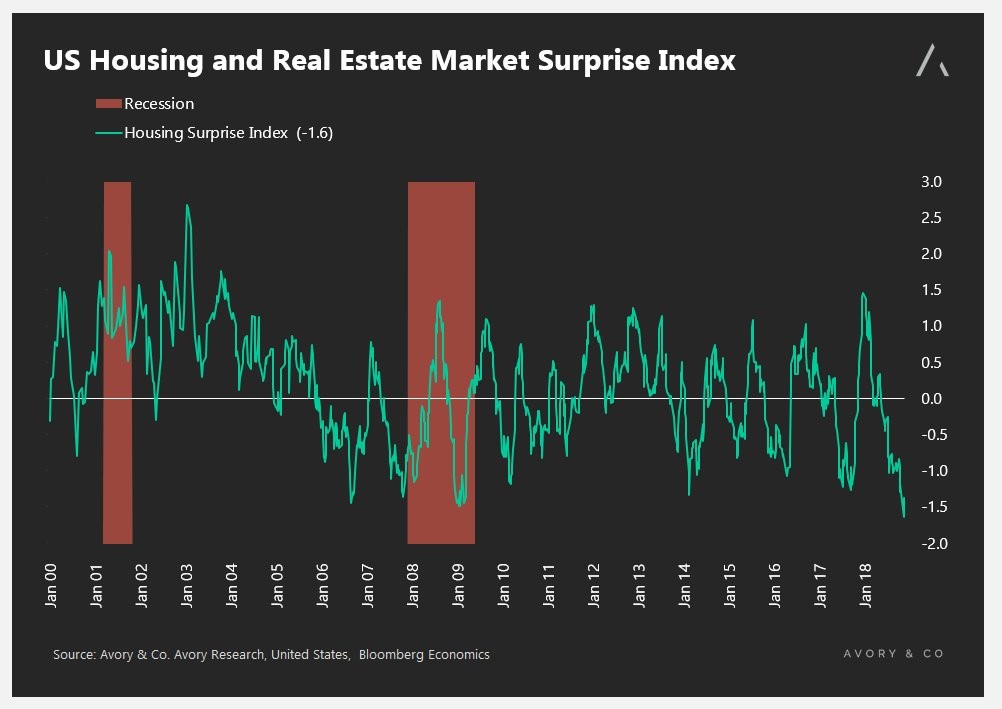
Source: Avory Research
The weakness is being led by new home sales, NAHB, and pending home sales. Keep in mind, surprise indexes don’t signal overall weakness. They signal weakness relative to expectations. This negative surprise index is disconcerting since it is coming along with overall weakness. To be clear, the housing market isn’t worse than the last cycle just because the index is at a record low.
Conclusion
The Fed is about to raise rates in December. If the Fed doesn’t change guidance for 2019 hikes, the 10/2 year curve will invert. This signals a stock market peak sometime in early 2020 and a recession sometime in late 2020. That’s just the average lead time. The economy could fall into a recession earlier and the stock market could have already peaked. The expectations for a rate cut in 2020 tell you some traders are preparing for a 2020 recession.
Have comments? Join the conversation on Twitter.
Disclaimer: The content on this site is for general informational and entertainment purposes only and should not be construed as financial advice. You agree that any decision you make will be based upon an independent investigation by a certified professional. Please read full disclaimer and privacy policy before reading any of our content.


