UPFINA's Mission: The pursuit of truth in finance and economics to form an unbiased view of current events in order to understand human action, its causes and effects. Read about us and our mission here.
Reading Time: 5 minutes
We pay attention to the Personal Consumption Expenditures’ inflation reading because it’s what the Fed follows the closest. October headline PCE inflation was up 0.2% month over month which met estimates for 0.2% growth and was above September’s growth rate of 0.1%. As the chart below shows, year over year PCE inflation was 2% which matched September’s reading, but missed estimates for 2.1% growth.
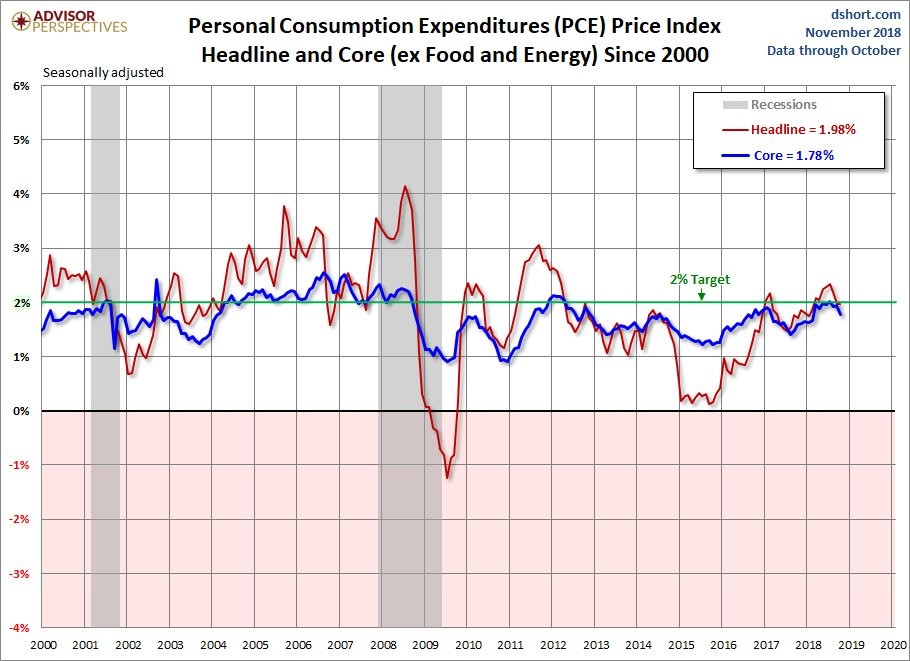
Source: Advisor Perspectives
The November reading should show weakness because oil prices were down 22%. That was oil’s biggest monthly loss in a decade. There has also been weakness in housing price growth which should negatively impact both core and headline PCE.
Inflation has never been able to stay above the Fed’s 2% target this cycle. This is because of cyclicality and the inability to lap tough comparisons without falling. Headline PCE peaked at 2.34% in July 2018 when it was being compared to inflation of only 1.48% in July 2017. Since inflation was higher later in 2017, the year over year growth rate has fallen. The weakness in economic growth is also important as Q2 GDP growth was 4.2% and the median of 10 estimates for Q4 GDP growth put it at 2.8%. High nominal wage growth hasn’t translated to higher inflation which is great news for workers as they will see real wage growth gains due to this decline in inflation and tight labor market.
Core PCE Weakened: Fed Could Lower 2019 Hike Guidance
Month over month core PCE inflation was up 0.1% which missed estimates and September’s growth rate which were both 0.2%. Year over year core inflation fell from 1.9% to 1.8%, missing estimates for 1.9%. Just like headline PCE, core PCE comparisons will get tough especially starting in March. In March 2018, core inflation increased from 1.66% to 1.96%.
The October core PCE reading is important because it’s the last reading before the December 19th Fed meeting. With the Fed’s favorite inflation reading falling below its target, the Fed can easily turn dovish. The Fed can justify its guidance change by repeating this data which will help it dodge criticisms of the decision being political or following the whim of the stock market.
There’s an 81.8% chance of a hike in December. That hike is a given. The real story is if it is a hawkish or dovish hike. The dot plot will be critical because the Fed has rates ending 2019 between 3% and 3.25% even though the Fed funds futures only expect one more hike after the one in December 2018 (bringing rates to 2.5% to 2.75%). The Fed ignored the inflation weakness in 2017 and raised rates 3 times because its forecasts expected higher inflation. However, 2019 is different from 2017 as growth has been slowing (in 2017 it was accelerating). The labor market is much stronger, but that won’t last long with 3 hikes in 2019.
The chart below shows where each portion of core inflation needs to be to get to the Fed’s 2% goal.
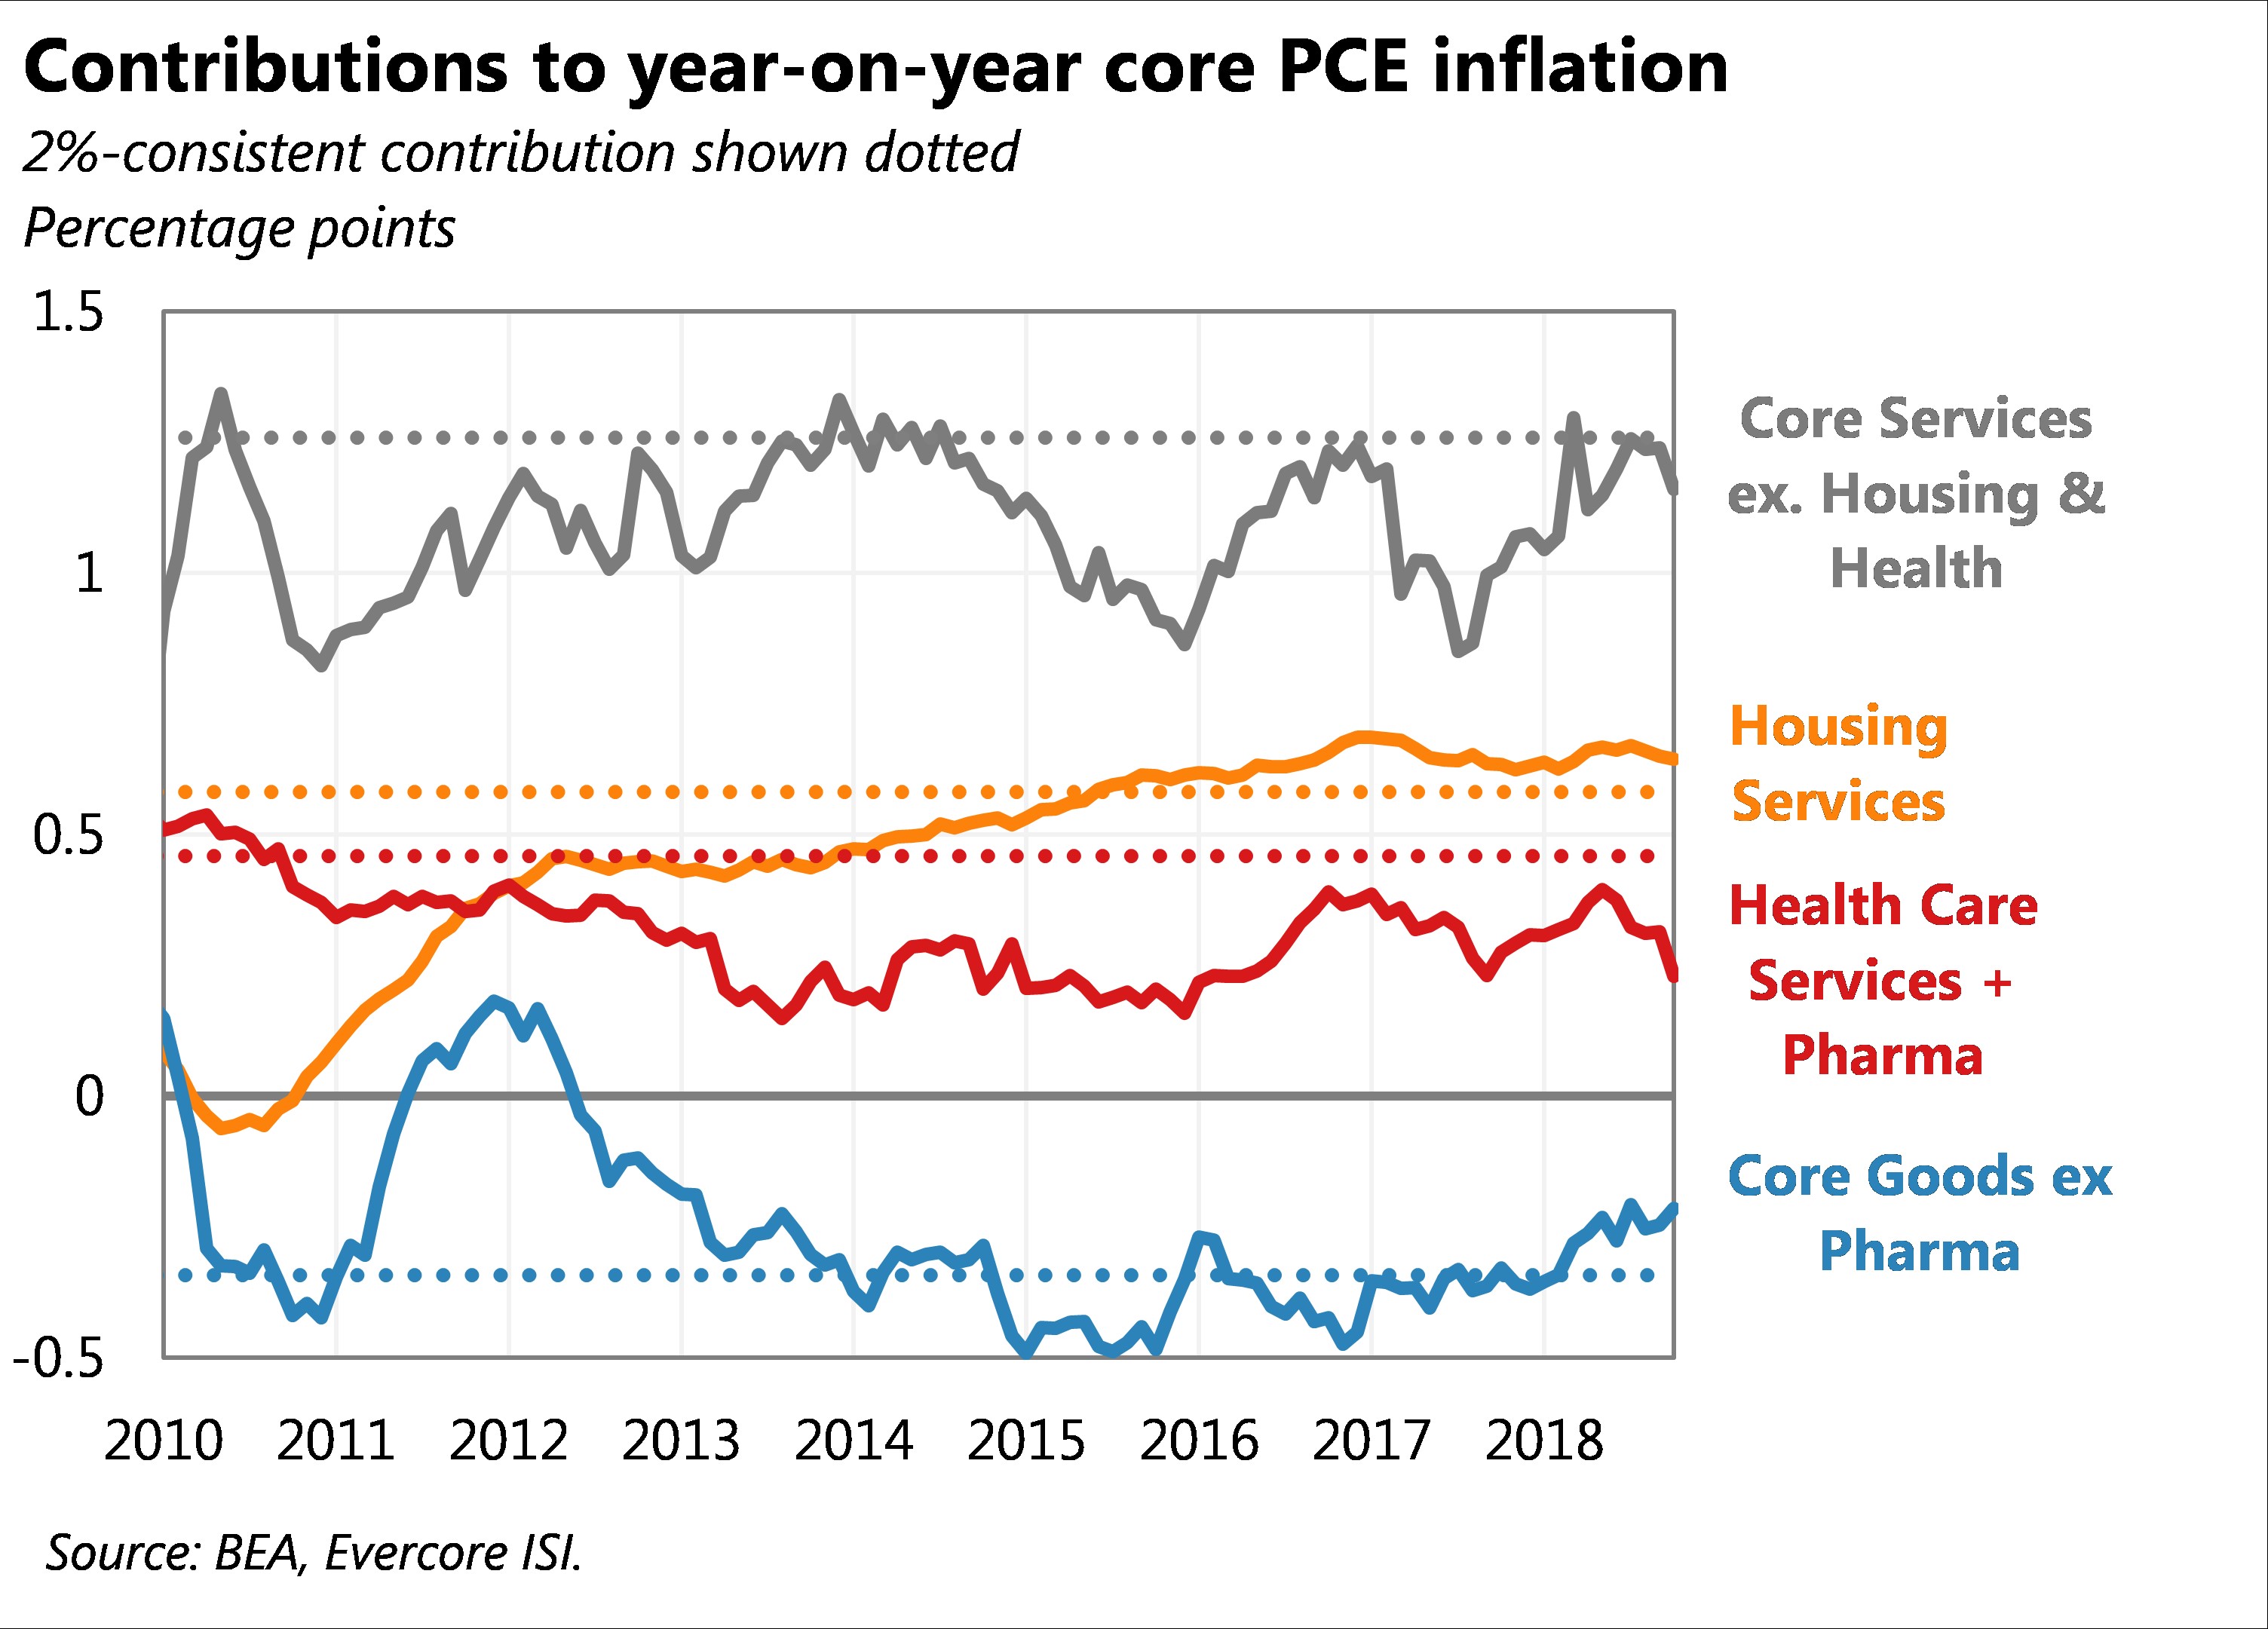
Source: Twitter @ErnieTedeschi
Both housing services and core goods excluding pharmaceuticals are above their necessary contribution. Housing services should see weakening inflation because the housing market is faltering. As we discussed in a previous article, the pending home sales index fell 6.7% year over year in October. Declining sales precede lower prices. On the other hand, healthcare services plus pharmaceuticals and core services excluding housing and healthcare contributed less than was needed to get to 2% core PCE inflation.
Strong Personal Income Growth & Spending Growth
This was a great report for the consumer because inflation slowed while income and consumption growth beat estimates. Personal income growth was 0.5% month over month which beat estimates for 0.4% growth and September’s reading of 0.2% growth. Sole proprietor’s income and interest income boosted results while wages and salaries were only up 0.3% month over month which matched September’s growth. About 0.1% of personal income growth came from farm proprietor’s income which includes the $12 billion Market Facilitation Program to help farmers deal with the tariffs. China didn’t boost its purchases of soybeans like it usually does at this time of year as it switched to Brazilian soybeans.
Even with that caveat, this was still a solid report. As you can see from the chart below, real disposable income growth was 2.8% year over year which is in between the peak in early 2015 and the trough in late 2016.
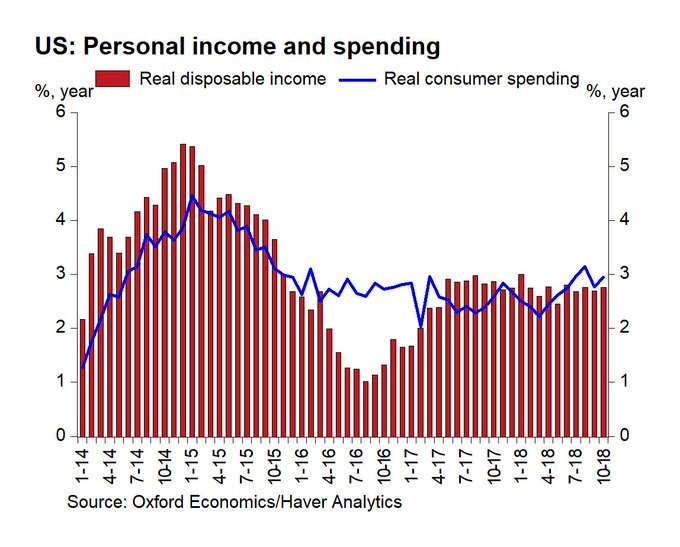
Source: Gregory Daco
Consumer spending growth was 0.6% month over month which beat estimates for 0.4% growth. It beat partially because the September report was revised lower as growth was changed from 0.4% to 0.2%. The year over year results show growth was still solid as real consumer spending was up 2.9%. Services was the strongest segment as services spending was up 0.7% month over month. As you can tell from the chart above, there has been a gap between spending and income growth in the past few months. It’s nowhere near the huge gap in 2016, but it’s still present which means the savings rate fell.
Savings Rate Falls To 6.2%
As the chart below shows, the savings rate fell from 6.3% to 6.2% which is the lowest rate since December 2017. If it falls one tenth more, it will be the lowest reading since March 2013.
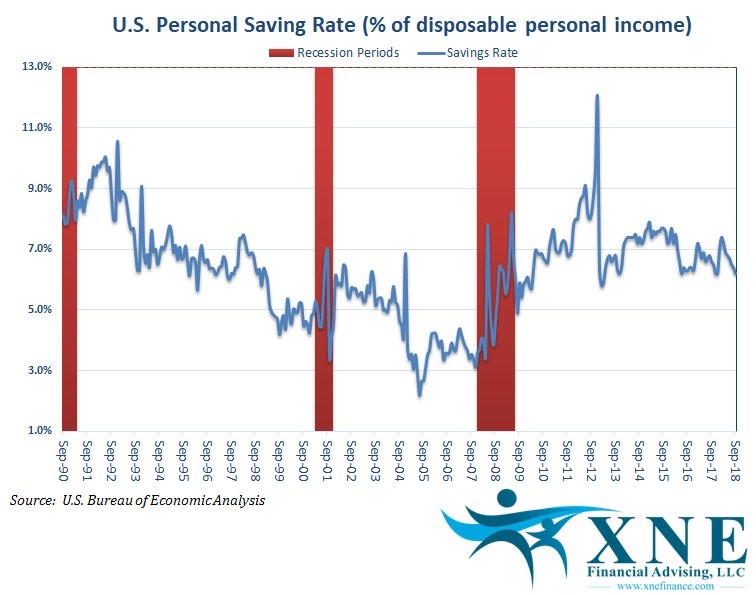
Source: XNE Financial Advising
Even with strong nominal wage growth shown in the ECI and BLS reports, the savings rate is falling. That’s good news for spending in the short run, but signals the consumer is starting to get too aggressive which will hurt growth in the intermediate term. It still has a long way to go to reach the previous cycle’s low of 2.2% which is the record low. We don’t see that being matched.
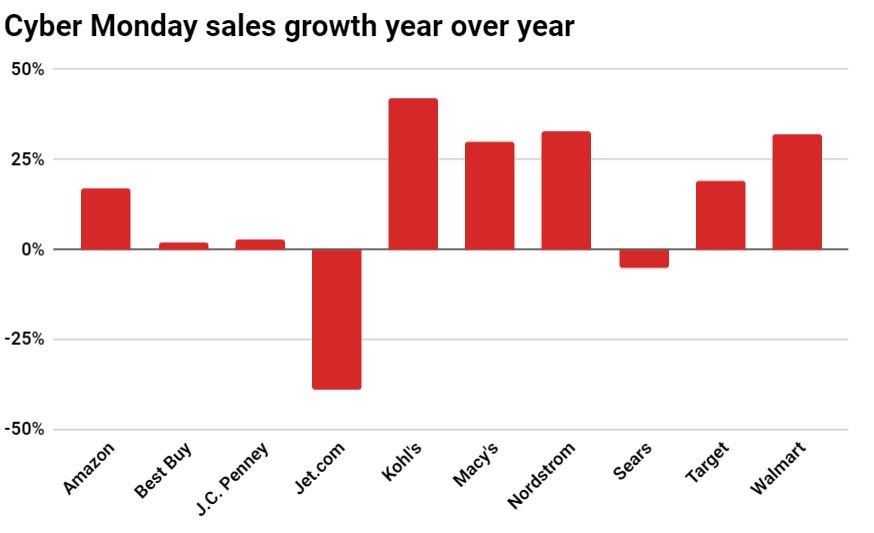
Cyber Monday Sales Growth
Cyber Monday showed spectacular growth which makes sense because online sales are taking share and the labor market is strong. According to Adobe Analytics, spending on Cyber Monday increased 19.3% year over year to $7.9 billion. The chart below shows how various retailers did. Keep in mind, Jet.com saw declines because it has been repositioned to complement Wal-Mart by servicing millennial city dwellers.
Source: Twitter @JerryCap
Conclusion
Inflation is falling because commodity prices are falling, comparisons are tough, economic growth is slowing, and housing price growth is slowing. The CRB Bloomberg commodities index is down 5.34% year to date. Nominal wage growth has been strong in other reports, but it wasn’t amazing in the PCE report as interest payments and sole proprietorship growth catalyzed the month over month acceleration in income growth. Keep in mind, this year there is an extra week between Thanksgiving and Christmas which means year over year spending growth might be even stronger than what has been implied by Black Friday and Cyber Monday sales growth.
Have comments? Join the conversation on Twitter.
Disclaimer: The content on this site is for general informational and entertainment purposes only and should not be construed as financial advice. You agree that any decision you make will be based upon an independent investigation by a certified professional. Please read full disclaimer and privacy policy before reading any of our content.


