UPFINA's Mission: The pursuit of truth in finance and economics to form an unbiased view of current events in order to understand human action, its causes and effects. Read about us and our mission here.
Reading Time: 4 minutes
Economic activity is at a standstill. We must rely principally on alternative data to measure this because of how quickly the collapse in activity has occurred. An example of this is the number of riders on the NYC subway. On March 17th, there were 1.8 million riders which was down from 5.6 million on the same day in the prior year. OpenTable shows there was an 84% decline in bookings on March 17th compared to last year. Many cities literally can’t get any worse. New York, Los Angeles, San Francisco, Seattle, DC, Boston, and Toronto all had 0 bookings. An optimist would say that will make for easy comps in 2021. A pessimist will say firms won’t make it to 2021 if they have no sales now. If you own a restaurant that can’t open for a few weeks, it’s cheaper to end the business than to take out a loan. What’s the loan for if there are no revenues?
The S&P 500 has had such a bad year that only 3 sub-industries were up as of the 18th. The 3rd worst performing industry year to date is hotels, resorts, and cruise lines which is down 66.81%. The hotel industry is asking the government for a $150 billion bailout. The worry for shareholders is that the equity gets wiped out. The situation is dire for these firms even if a cure for COVID-19 is found this summer and economic activity gets back to normal in a few months. As you can see from the chart below, at this point in the year occupancy in hotels is usually in the high 60% range as we are in spring break season. The past week was dreadful for these firms as occupancy has fallen to the low 50% range. That weakness will continue in the next few weeks as shutdowns only amp up.
If you’re curious, the airlines are also in dire shape. On Wednesday, Delta announced it would shrink its flight coverage by 70%. The firm is eliminating 80% of its international flights in the next 2-3 months. It expects sales in March to be $2 billion less than last month.
Small Business Disaster
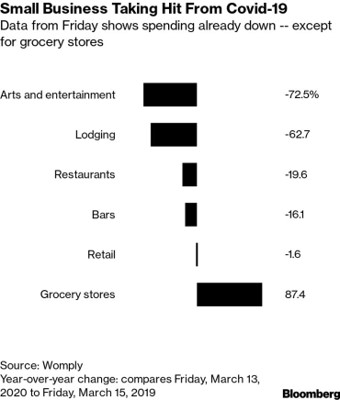
Small businesses are in a world of hurt even though the economic shutdown in America is only in its early stages. As you can see from the chart below, the yearly change in sales on March 13th was disastrous for arts & entertainment, lodging, restaurants, and bars.
We already know from the OpenTable data that restaurant sales got worse in the following days. Many of these firms will go out of business this spring because small businesses don’t have flexible financing. According to JP Morgan, half of small firms have 15 days of cash or less.
JP Morgan Predicts A Depression
As we have been discussing this week, estimates for economic growth have come down dramatically. The most comprehensive negative outlook came from JP Morgan on Wednesday. The table below is shocking to look at. The numbers don’t seem real. No one would believe them if you showed them to investors 4 months ago.
As you can see, America and Europe are expected to have contractions of 14% and 22% in Q2. Because China’s weakness is in Q1, rather than Q2, global growth is actually expected to be worse in Q1 than Q2. Q1 Chinese growth could be -40.8% and Q1 global growth could be -12%. The recovery is expected to be swift as JP Morgan sees a ‘V shaped’ recovery. China will have 57.4% Q2 growth, while America and Europe will have 8% and 45% Q3 growth. That will lead to 19.1% Q3 global growth.
Small Caps Are Cheap
Small cap stocks are extremely cheap on a forward PE basis. That’s to be expected because the S&P 600 has fallen about 41% since February 20th. These firms have fallen sharply because access to capital is becoming constrained. Many of these firms aren’t profitable. As you can see from the chart below, the S&P 600’s PE ratio fell to 10.5 on March 18th which is very close to its fall of 2008 trough.
The counterpoint to the low PE argument is that the earnings outlook is uncertain. However, the outlook was uncertain in October 2008 as well. Earnings were terrible in 2009 and they will be terrible in 2020. That’s a given.
Synchronicity
In extreme market circumstances, risk assets trade together. We’ve even seen treasuries and stocks sell off together as liquidation events occur. When stocks fall vertically, they fall together. That’s why we’ve seen the percentage of S&P 500 stocks above their 200 day moving average in the low to mid-single digits. As you can see from the chart below, the implied correlation of the S&P 500 has risen to 86.35%. During Wednesday’s session, the correlation defied the basic rules of math by getting above 100% to 101.25%. That’s the ultimate sign of a panic. It doesn’t get any worse.
China’s Recovery
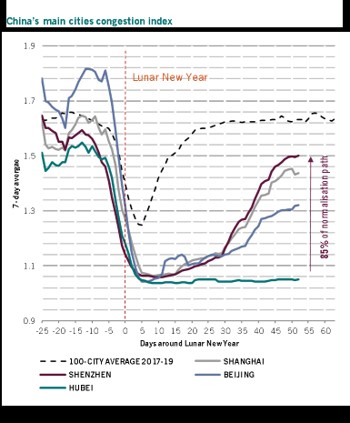
China’s economic recovery provides a glimmer of hope for America and Europe which desperately need any good news they can get. In China, FedEx stated demand rebounded more than expected. 65% to 70% of small businesses are operating and 90% to 95% of large manufacturing firms are operating. The chart below shows the congestion index in the main cities.
Shenzhen has 85% of normalized traffic, while Hubei hasn’t recovered at all. China is up to 61% of its normalized coal consumption. Remember, China started dealing with COVID-19 in late January. This is about 2 months later. We could be seeing good headlines in America starting in May.
Conclusion
The hotels, restaurants, airlines, and small businesses (outside of grocery stores) are getting hammered. JP Morgan expects the deepest recession since the Great Depression. The good news is anything less, is a positive. The bad news is if the weakness lasts into the 2nd half of 2020, we could see risk assets adjust to the downside. Small cap stocks are the cheapest since 2008. Stocks are moving in perfect synchronicity which is a sign of extreme panic. The Chinese economy is well on its way to a recovery except in Hubei which is where COVID-19 started.
Have comments? Join the conversation on Twitter.
Disclaimer: The content on this site is for general informational and entertainment purposes only and should not be construed as financial advice. You agree that any decision you make will be based upon an independent investigation by a certified professional. Please read full disclaimer and privacy policy before reading any of our content.


