UPFINA's Mission: The pursuit of truth in finance and economics to form an unbiased view of current events in order to understand human action, its causes and effects. Read about us and our mission here.
Reading Time: 4 minutes
The latest Case Shiller home price index report is for August as it came out a week later than the FHFA reading which showed price growth fell from 5% to 4.6%. Even though this report was late, it has a few interesting tidbits. Yearly national price growth rose for the first time since March 2018 and the 20 city seasonally adjusted monthly growth rate was negative for the 2nd time since March 2012. Let’s delve into how that happened. Firstly, national yearly growth only increased from 3.14% to 3.165%. That’s barely a difference, but it looks like an improvement because of rounding. The 2 year growth stack actually fell because growth last year fell from 5.68% to 5.45%.
Weak Home Price Growth Again
Even with that rounding issue understood, there was a big difference between growth nationally and in the cities. It was even worse in the big cities. The 20 city index had -0.16% growth monthly growth on a seasonally adjusted basis and 2% yearly growth on a non-seasonally adjusted basis. It’s important to seasonal adjust results when dealing with sequential data. Furthermore, the 10 city index’s yearly NSA growth rate was just 1.5%. That’s the weakest growth since August 2012. The table below breaks down the price growth in each city.
Even though the big cities had weak price growth, price growth in Phoenix accelerated from 5.75% to 6.29% which is the best reading since February. The 2 year growth stack only marginally improved though as growth fell from 7.4% to 7.02% last year. The comps tell you a lot about each city’s results. Home price growth in Las Vegas continued to tumble as it fell from 4.68% to 3.31%. Growth peaked last August at 13.83%. It’s actually impressive current growth was positive. Growth in Seattle went positive because the comp got much easier. Growth went from -0.65% to 0.66% as the comp went from 11.52% to 9.54%. The 2 year stack actually got worse even though growth improved.
Homeownership Rate Improves
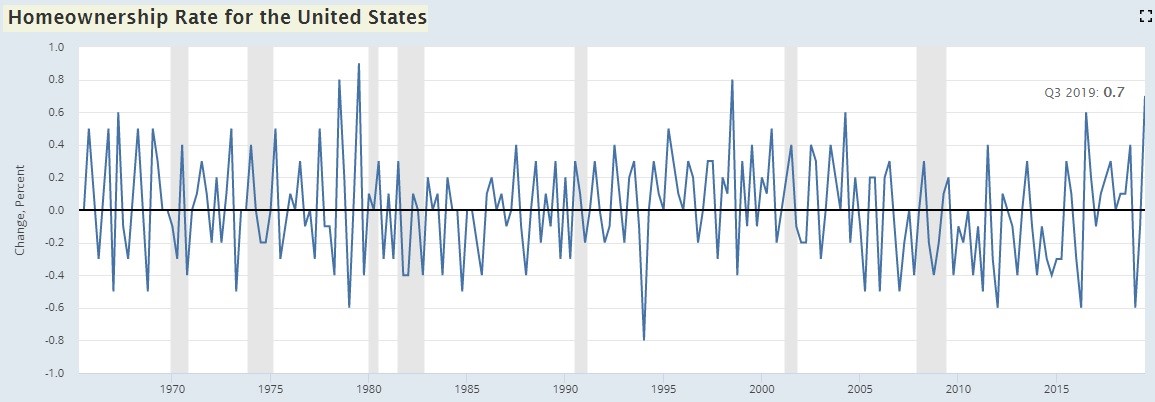
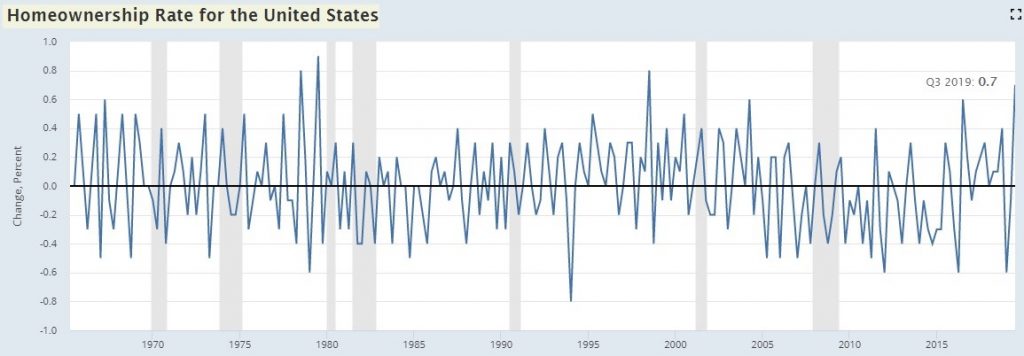
This expansion has been known for the normalization of the housing market after the housing bubble burst. Unfortunately, with this normalization came a decline in the homeownership rate. It fell from 67.6% in Q3 2009 to 62.9% in Q2 2016. That was the weakest reading since Q3 1965. That clearly was a suppressed level which makes it unsurprising that the rate has since recovered even though many state housing markets are unaffordable. It’s tough to say what is normal, but the current rate is near the long term average excluding the housing bubble. In Q3 2019, the rate increased from 64.1% to 64.8% which is tied for the highest rate since Q1 2014 back when the rate was still falling. As you can see from the chart below, that’s the biggest quarterly increase in the homeownership rate since it increased 0.8% in Q3 1998.
As you can see from the chart below, the increase in the homeownership rate has occurred because of strong growth in owner households and a small decline in renter households.
Specifically, there was a 1.4 million increase in owner occupiers and a 33,000 decrease in renter households. Furthermore, the homeowner vacancy rate fell to the lowest level since 2002.
Strong Pending Home Sales
There was a recent lull in housing data making some question how much momentum housing had. Then we had new home sales slightly beat estimates and now we have a very strong September Pending Home sales report. The Pending Home sales index increased 1.5% monthly on top of a 1.6% increase in August. That growth rate beat estimates for 0.7%. The actual index improved from 107.3 to 108.7. Anything above 100 means housing signings are above the 2001 rate. Yearly growth was 3.9%. As you can see from the chart below, pending home sales lead existing home sales by 1 month which means we should expect another good existing home sales report in September.
This report was boosted by the South which is the biggest region. It had yearly growth of 5.7% as its index was a very impressive 127.5. The West, which is the 2nd biggest region, had its index improve 3.4% yearly, but it was only at 95.1 which was the 2nd lowest index. The weakest was the Northeast at 93.9. National buying power increased 6% from last year because of the decline in interest rates. Unlike what the new home sales report suggested, the upper end of the housing market appears to be doing well.
Solid Consumer Confidence
Redbook same store sales growth in the week of October 26th improved 0.2% for the 2nd straight week, but growth was only 4.5% which is below its range of 5% to 6% in August and September. The Conference Board consumer confidence index rose from the initial September reading, but fell from the upwardly revised reading. The index was revised from 125.1 to 126.3. In October, it fell to 125.9 which missed estimates for 128.8. The present index rose from 170.6 to 172.3, but the expectations index fell from 96.8 to 94.9.
The most interesting aspect of these surveys is always the consumer’s opinion of the labor market, because that’s what the consumer knows best. Those saying jobs are plentiful rose from 44.5% to 46.9%, but those saying jobs are hard to get rose from 11% to 11.8%. The net difference improved from 33.5% to 35.1% as you can see from the chart below.
Expectations on the labor market were much more disconcerting as those expecting more jobs in the next 6 months fell from 17.6% to 16.9% and those expecting fewer jobs rose from 15.4% to 17.8%. The net difference fell from 2.2% to -0.9%. That’s the first negative reading since January 2019.
Conclusion
Home price growth was weak again even though the national home price growth rate improved slightly. The top 10 cities only had 1.5% growth. The homeownership rate spiked the most since Q3 1998. It has been improving ever since its multi-decade bottom in Q2 2016. The Pending Home sales report was very strong. The Conference Board consumer confidence index was solid, but expectations for the labor market slipped to the negatives for the 2nd time this year.
Have comments? Join the conversation on Twitter.
Disclaimer: The content on this site is for general informational and entertainment purposes only and should not be construed as financial advice. You agree that any decision you make will be based upon an independent investigation by a certified professional. Please read full disclaimer and privacy policy before reading any of our content.


