UPFINA's Mission: The pursuit of truth in finance and economics to form an unbiased view of current events in order to understand human action, its causes and effects. Read about us and our mission here.
Reading Time: 4 minutes
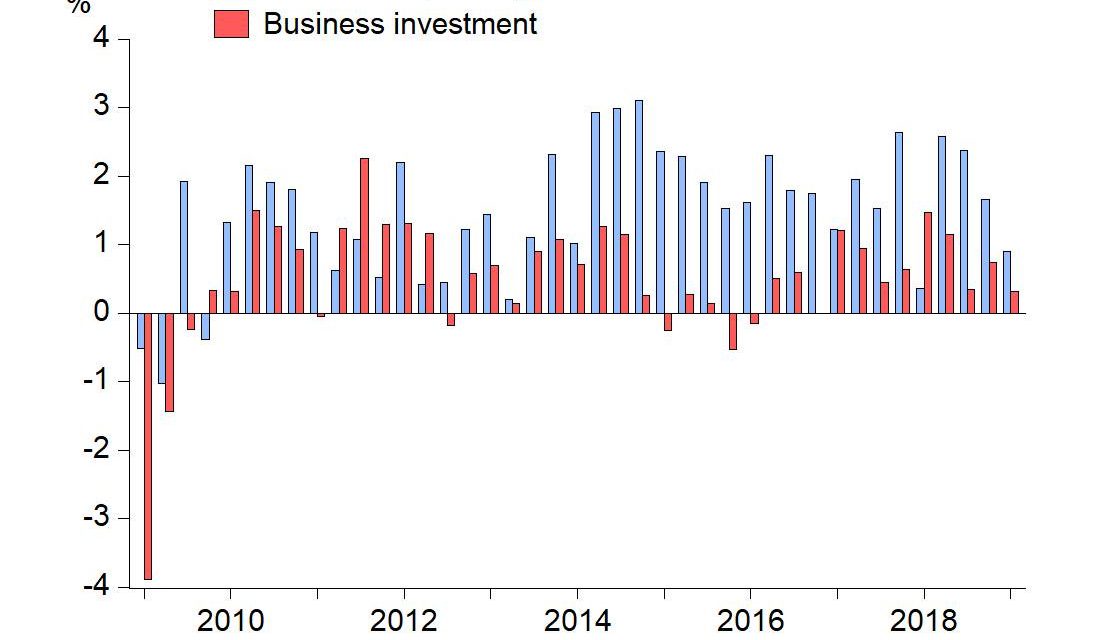
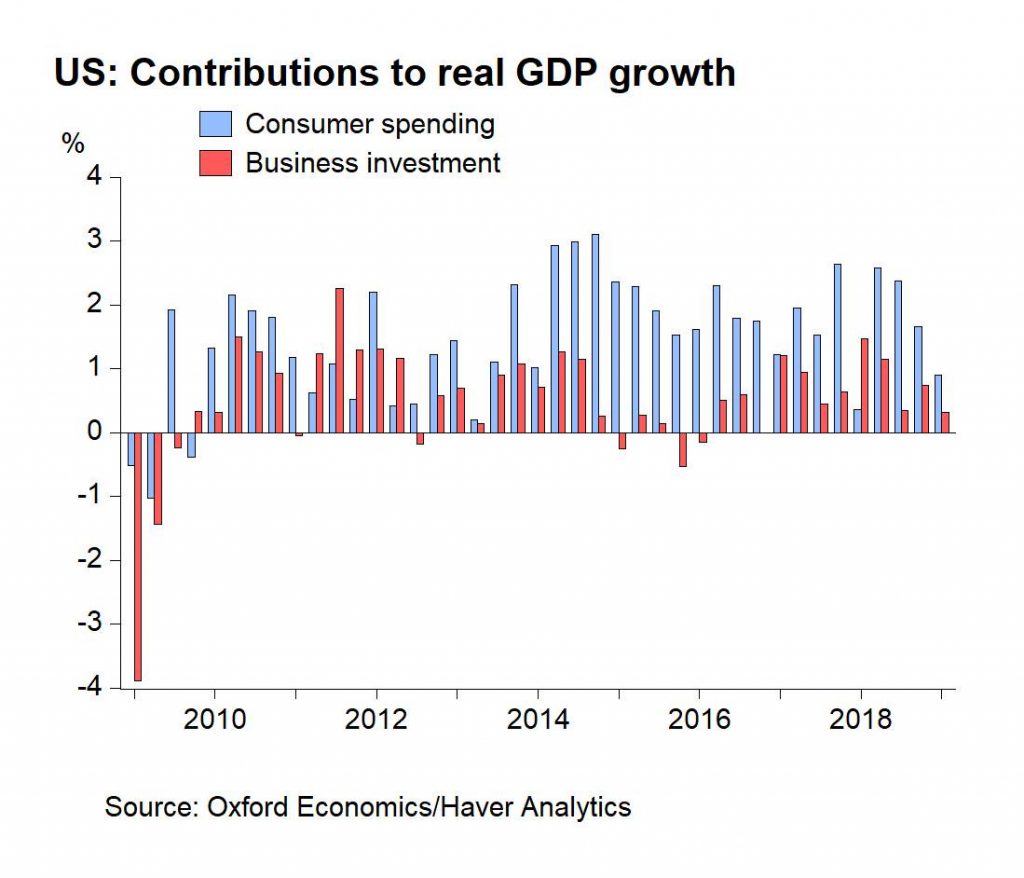
With the first revision to Q1 GDP, we got a reminder that the report wasn’t good. Specifically, real quarterly growth fell from 3.2% to 3.1%. Headline growth is the best part of the report. The details are grim. The big unsustainable driving forces of GDP growth, which were net exports and the change in inventories, were revised lower. Inventories helped growth by 0.6% instead of 0.65% and trade helped growth by 0.96% instead of 1.03%.
Fixed investment was revised lower as it only helped growth by 0.18% instead of 0.27%. Real residential fixed investment hurt growth by 13 basis points instead of 11 basis points. It had a 3.5% annual contraction. The hope is Q2 ends this negative streak at 5. However, the Atlanta Fed Nowcast still expects negative growth even after some encouraging housing reports. Real consumer spending growth was revised up from 1.2% to 1.3%. That’s still a poor reading for an economy with a strong labor market.
There’s risk that trade and inventory will drag down Q2 growth. Inventories may have been bolstered because of pre-buying before the tariffs were enacted. The advanced wholesale inventories report for April showed growth of 0.7% which beat estimates for 0.3% and March’s 0% growth rate. That’s an early positive for Q2 growth. Let’s see if inventories suddenly stop increasing in June after both the American and Chinese tariffs go into effect.
As you can see from the chart below, gross domestic income growth was only 1.4% which was much weaker than GDP growth.
GDI is the sum of all income in the economy instead of the sum of all production. The calculation is GDI equals rental income plus interest income plus profits plus wages plus statistical adjustments. GDO is the average of GDP and GDI. It was up 2.2% quarterly and 2.5% yearly. It’s a good leading indicator for GDP growth.
Another Trade War
Just when investors were breathing a sigh of relief that the trade war with Canada and Mexico was over because the metals tariffs were eliminated, President Trump tweeted that America will put a 5% tariff on all Mexican imports starting on June 10th. That rate will rise 5% per month until October 1st when it reaches 25%. Trump is using this threat to get his way on immigration as he wants Mexico to stop illegal migrants from passing through Mexico and into America. It’s debatable if this new tariff is legal because tariffs are supposed to be done for economic reasons. The NY Times stated this will face “serious legal challenges.” However, the damage has already been done because uncertainty has increased which will hurt businesses’ ability to plan for the future. They are like a deer in headlights.
There appeared to be an opening for Trump to give in to China because he is facing an election in 17 months, the stock market is falling, and the economy is weakening. However, with this latest action, it doesn’t look like he’s ready to give an inch. As you can see from the chart below, in Q1 America’s imports from China fell $17.14 billion which was a 14% year over year decline.
That decline in imports was made up for by other emerging markets. Imports from Vietnam, South Korea, and India were up 40%, 18% and 15%. As you can see, in nominal dollars, Mexico was the biggest beneficiary of this shift. It will be interesting to see how trade shifts if the trade war with Mexico ratchets up in the coming months.
Big Rally In Treasuries
With the weak economic reports and the latest tariffs levied on China and proposed for Mexico, treasuries have been rallying. This rally is a part of the global rally in government debt as the German 10 year bond yield hit -21 basis points which is its lowest yield in history. Since the treasury curve is strongly signaling the Fed will cut rates, much of the curve is below the Fed funds rate.
Investors are wondering what the 10 year yield falling below the 3 month bill means for the business cycle. According to the table below, it becomes a valid indicator of heightened recession risk when it stays inverted for 10 days. We are on day 7 now.
The average time, after this inversion reaches 10 days, until the next recession is 311 days based on the last 7 basis cycles. Keep in mind the 10 year yield is still higher than the 2 year yield and the 30 year yield is still the highest. Most of the curve isn’t signaling there will be a recession, which in our view may be the most important indicator. Treasury investors just see nominal growth slowing significantly.
Pending Home Sales Fall Monthly In April
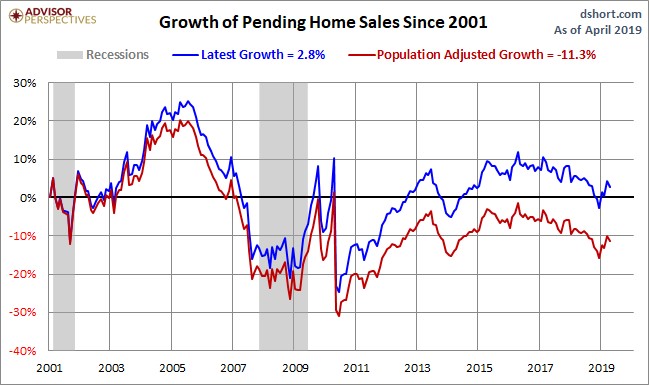
Pending home sales are a leading indicator for the housing market. Despite the decline in home price growth and the decline in interest rates (the average 30 year fixed rate fell to 3.99% in the week of May 30th which is the lowest reading since January 11th, 2018), April pending home sales missed expectations. Monthly growth was -1.5% which missed estimates for 0.5%. The March reading showed strong monthly growth of 3.9%.
In April, the index declined from 105.9 to 104.3. The index was down 2% year over year which makes this the 16th straight month of annual losses. The index will need to increase to 105.9 next month to end this negative streak. As you can see from the chart below, since 2001, pending home sales are up 2.8%. Population adjusted pending home sales are down 11.3% in that period.
Conclusion
GDP growth was strong in Q1, but the underlying numbers weren’t. Another trade war, this time with Mexico, adds to the uncertainty and will potentially hurt the economy. The treasury market is pricing in rate cuts soon, so most of the curve is below the Fed funds rate. When the 10 year yield is below the 3 month yield for 10 days, it is a recession warning. We need to see 3 more days of this to confirm the indicator. Housing reports have mostly been beating estimates, but the pending home sales report was disappointing.
Have comments? Join the conversation on Twitter.
Disclaimer: The content on this site is for general informational and entertainment purposes only and should not be construed as financial advice. You agree that any decision you make will be based upon an independent investigation by a certified professional. Please read full disclaimer and privacy policy before reading any of our content.


