UPFINA's Mission: The pursuit of truth in finance and economics to form an unbiased view of current events in order to understand human action, its causes and effects. Read about us and our mission here.
Reading Time: 5 minutes
If the economy doesn’t fall into a recession by June 2019, this will be tied for the longest expansion since the 1800s. Technically, we won’t know if there was a recession by June until a few months from now because the finalized data hasn’t come out yet. The consensus is for 1.7% GDP growth in Q2. While economic reports have been weak, very few of them suggest the economy is in a recession. The bears love to point to 2008 when the economic data was revised sharply lower after the fact. How about the 10 years since then when economic data wasn’t revised sharply lower to indicate a deep recession?
Longest Cycle Since The 1800s
On this 10 year anniversary of the expansion, bulls should celebrate the extreme skepticism that the bears have expressed this entire expansion and bull market. This is the fuel that has allowed the rally since 2009 to last so long. Bears have suffered from extreme recency bias when claiming the next recession will be as bad as the last one. While that’s not impossible, remind yourself that consumers have deleveraged this cycle and the type of mortgages that led to the housing bubble are illegal now. Here are the other reasons why its unlikely to happen two times in a row.
High Recession Risk
Just as this cycle is about to become the longest one since the 1800s, we are seeing an increase in recession calls. Those haven’t come out of the blue as we have seen a cyclical slowdown combined with a trade war with China and potentially one with Mexico as well. Every slowdown has the potential to catalyze a recession. This is the 3rd slowdown of this 10 year expansion. The prior 2 didn’t have large enough catalysts to push the economy into a recession.
Don’t become a bull with hindsight bias. They think that because the past 2 slowdowns didn’t lead to a recession, the economy will never fall into one again. While the economy is more diversified, it’s also more integrated into the global economy which gives it a new risk. If you think the Fed can perfectly control the economy (and prevent recessions), how come it can’t get inflation to its 2% target? Extreme viewpoints on the bullish and bearish sides are usually catalyzed by biases. To be clear, there are circumstances where it makes sense to be extremely bullish or bearish, but those are rare occasions.
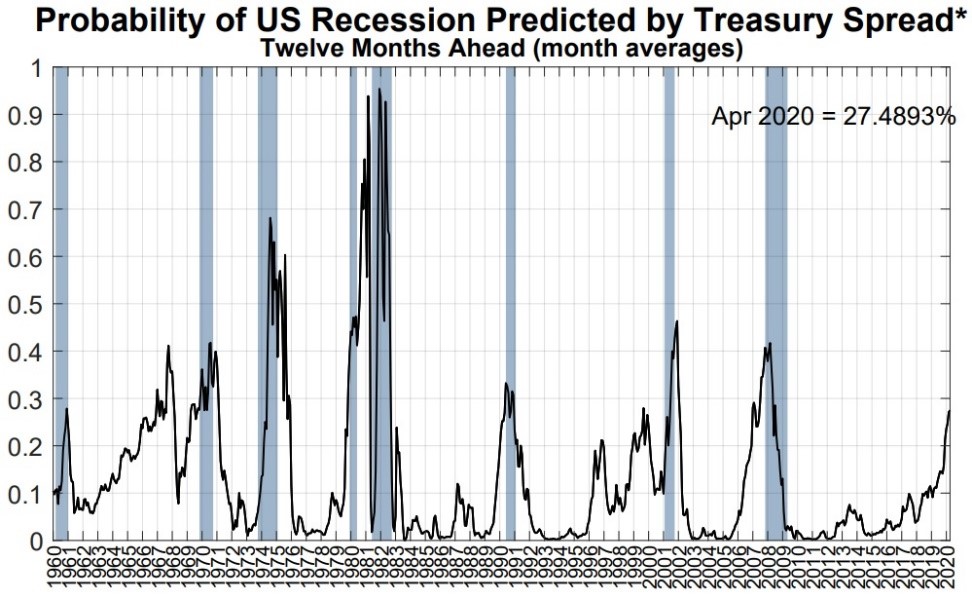
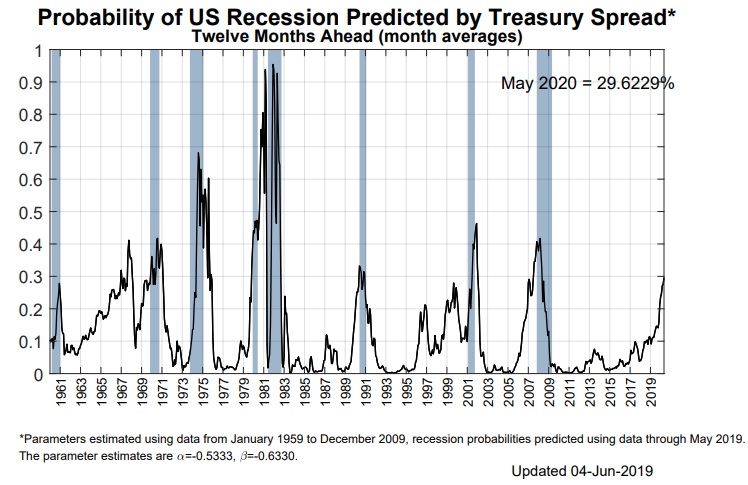
According to the JP Morgan’s recession risk model, the risk of a recession in the next year is above 40%. It peaked at above 30% during the 2016 slowdown. That’s a black box. We don’t know the formulas used to create that model. What we can say is the recession models that use the yield curve have been starting to show a higher risk of a recession. That’s why the NY Fed’s recession model, seen below, shows the risk of a recession increasing.
As you can see from the chart below, the Duncan Leading indicator is now predicting a recession.
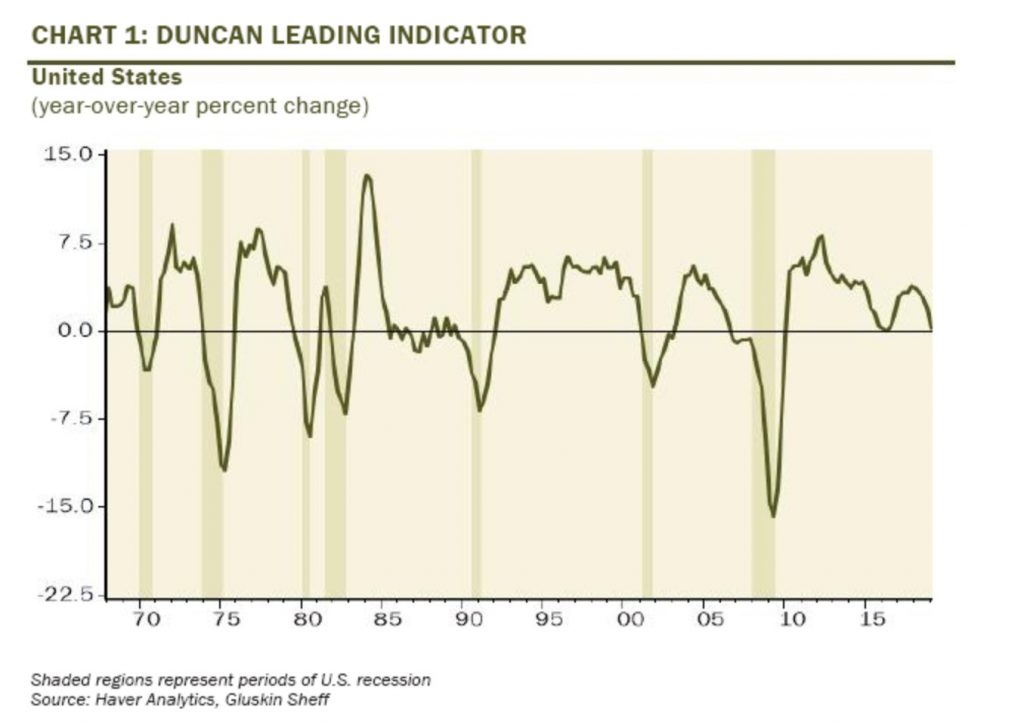
Since the late 1960s, this recession indicator had only one false positive reading which was in the mid-1980s. It correctly flashed the last 7 recessions. It almost predicted a recession in 2016. That was a close call. This indicator reviews parts of the economy that are affected by cyclical demand such as household spending and compares those readings with economic growth. Specifically, the indicator is durable goods plus fixed investment as a percentage of final sales. If durables goods and fixed investment are growing faster than final demand, a peak in the indicator should come before a decline in economic activity.
April Personal Income & Outlays Report
Real disposable income growth increased while real consumer spending growth fell on a yearly basis. That means the savings rate increased. Specifically, in April it increased from 6.1% to 6.2%. In a previous article we discussed how either income growth would need to catch up to spending growth or the savings rate would plummet. There wasn’t much room for the savings rate to fall as much as it did in March again. Hence, the expectation that income growth would improve in relation to spending growth was accurate.
Personal income growth was 0.5% monthly which beat estimates for 0.3% and the high end of the consensus range which was 0.4%. The prior reading was 0.1%. On a yearly basis, growth was 2.2%. Real consumer spending growth was 0.3% monthly which beat estimates for 0.2%. The comp was tougher as March’s growth was revised from 0.9% to 1.1%.
As you can see from the chart below, yearly growth in consumer spending fell to 2.7%.
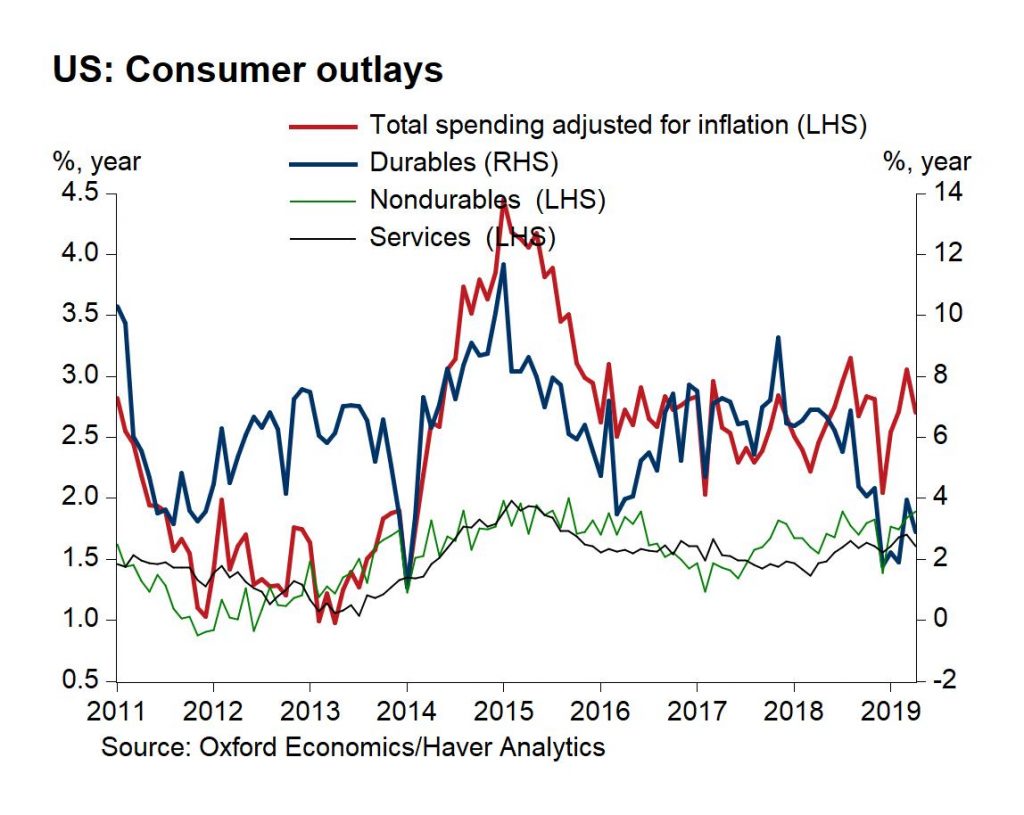
Spending on durables was down 0.4% monthly as it was hurt by autos which fell 1.7% after rising 9.4% in March. The weakness in April is more in line with the trend in auto sales. Non-durables spending was up 0.3%. Spending on services fell 0.1% after lapping 0.4% growth in March. There was broad based weakness in this category. Keep in mind, this data is monthly and the chart shows yearly growth.
Consistent PCE Inflation
This report also included the April PCE inflation reading. Monthly headline PCE inflation was 0.3% which met estimates and was above the 0.2% growth in March. That led to 1.5% yearly headline inflation which was up from March’s 1.4% reading, but missed estimates for 1.6%. Monthly core PCE inflation was 0.247% which met estimates and was above the previous month’s reading of 0.1%. The all-important, yearly core PCE inflation rate was 1.6% which met estimates and was above March’s 1.5% core inflation. Investment advice and portfolio management inflation rose like Powell expected. However, even with that improvement core PCE inflation didn’t get to the Fed’s 2% target, showing that wasn’t the main category that suppressed inflation. Core PCE inflation has been below 2% for 9 months in a row.
Conclusion
The bears calling for a recession as bad as the one in 2008 to occur soon have been wrong for 10 years. That being said, you don’t want to completely ignore the recession risk as many models are showing increasing odds of one happening in the next year. The cyclical economic weakness can be amplified by the trade war. We haven’t seen the full effects of the tariffs on the hard data because the latest hard data is from April and the biggest tariff by far was announced on May 10th.
Have comments? Join the conversation on Twitter.
Disclaimer: The content on this site is for general informational and entertainment purposes only and should not be construed as financial advice. You agree that any decision you make will be based upon an independent investigation by a certified professional. Please read full disclaimer and privacy policy before reading any of our content.


