UPFINA's Mission: The pursuit of truth in finance and economics to form an unbiased view of current events in order to understand human action, its causes and effects. Read about us and our mission here.
Reading Time: 5 minutes
In the short term valuations aren’t important to stock performance, but in the long run they provide the best information about expected returns. Stocks are one of the few assets that experience selling pressure when they go on sale. That’s because trend followers, who are focused on the short-term, are selling to avoid further losses. One great way to outperform the market is to exhibit patience in the face of panic. Utilize a long term approach when stocks are going on sale.
It’s never clear whether stocks are expensive or cheap because there are metrics which conflict; changes to the fundamentals can affect whether a market is expensive or cheap. On the one hand, stocks didn’t have extremely high multiples on their expected earnings in 2007, but the unstable banking system, which was built off trading mortgage backed securities which weren’t properly priced for the losses they could incur, meant the fundamentals weren’t sound. Some investors separate the fundamentals from valuations because they claim the fundamentals are the factors that drive businesses in certain directions and valuations are multiples on the future earnings. However, value is based on if a business or economy is expected to grow, remain stable, or shrink which is why we think the fundamentals and valuations are inextricably linked.
Forward PE Multiple
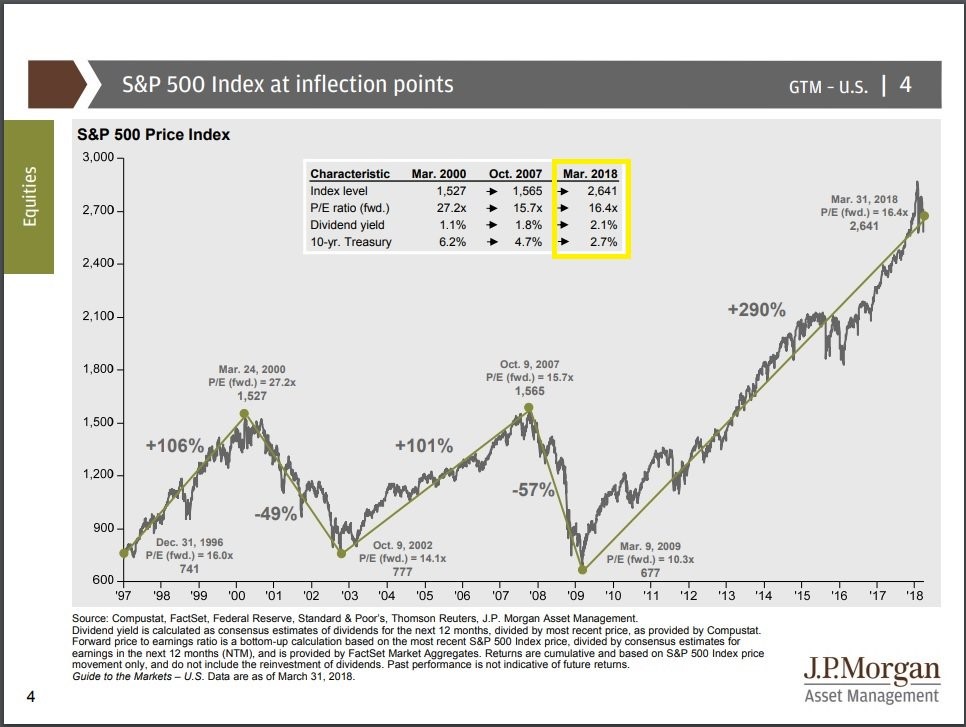
Since stocks are based on their future ability to generate profits, the forward PE multiple is important to valuing the S&P 500. Even though the stock market had a great 2017, the forward PE compressed in 2018 to the lowest since 2016 because earnings estimates have risen. As you can see from the chart below, the current forward PE is 16.4 and the dividend yield is 2.1%.
The 25 year average forward PE is 16.1. Despite increasing 290% in this bull market, the forward PE is much lower than the peak in March 2000 which was 27.2. The market is a bit more expensive than the peak in October 2007 when there was a forward PE of 15.7, but that market was brought down prematurely by the mortgage crisis. The multiple wasn’t much higher than the 14.1 that the market bottomed at in October 2002.
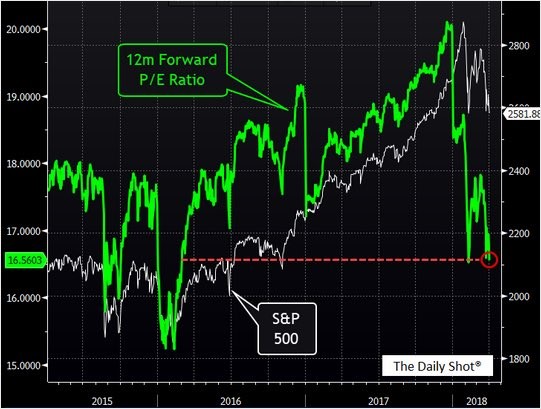
The point we mentioned about fundamentals comes into play with understanding why the forward PE was relatively high in 2017. As you can see from the chart below, the forward PE was 17.5 in March 2017, yet stocks did well in 2017. That’s because the high multiple was pricing in the increased earnings growth that was about to come from the tax cuts and acceleration in economic growth. The forward PE compared to last year is 6% cheaper even as the S&P 500 is 11.7% higher. If you think earnings growth will be higher than what’s priced in, you’ll pay a higher multiple.
The Contributions To 2018 Earnings Growth
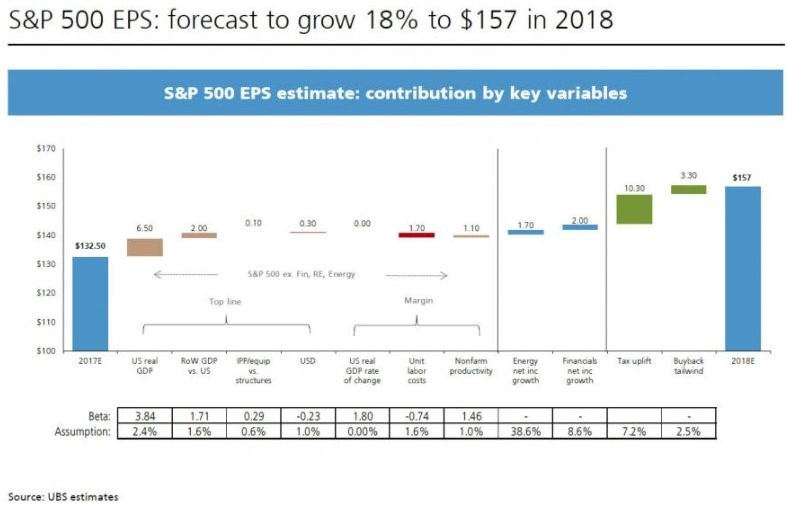
As you can see from the chart below, the S&P 500 earnings growth in 2018 is expected to be 18%.
The bars break down the contributors to the $157 in bottom up earnings per share. The total EPS will be up $24.5. The biggest contributor to earnings is the uplift related to the tax cuts as the earnings are expected to be moved up by $10.30 because of this legislation. The second biggest driver of the earnings improvement is the growth in U.S. real GDP which will help EPS by $6.50. Stock buybacks help earnings by $3.30. The other global economies have an impact on earnings because 31% of the S&P 500’s revenue exposure is from international markets.
Fairytale Estimates?
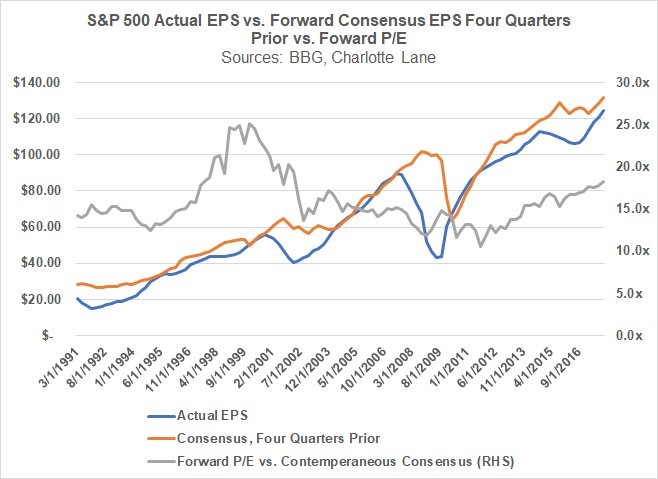
The biggest criticism of using forward earnings estimates is that the estimates by analysts are usually too optimistic. Determining the accuracy of these estimates is the secret sauce that helps you make money. The chart below compares the forward earnings estimates pushed back a year with the actual results.
The actual results usually miss the estimates with the exception of periods where the economy is coming out of a recession. The grey line shows the forward PE at the time the consensus was made. To be clear, the blue line will be popping much higher than the orange line because the tax cuts weren’t in the estimates until January. The market anticipated them earlier than the analysts with its big rally and no corrections in 2017.
2018 Looks Great For Earnings
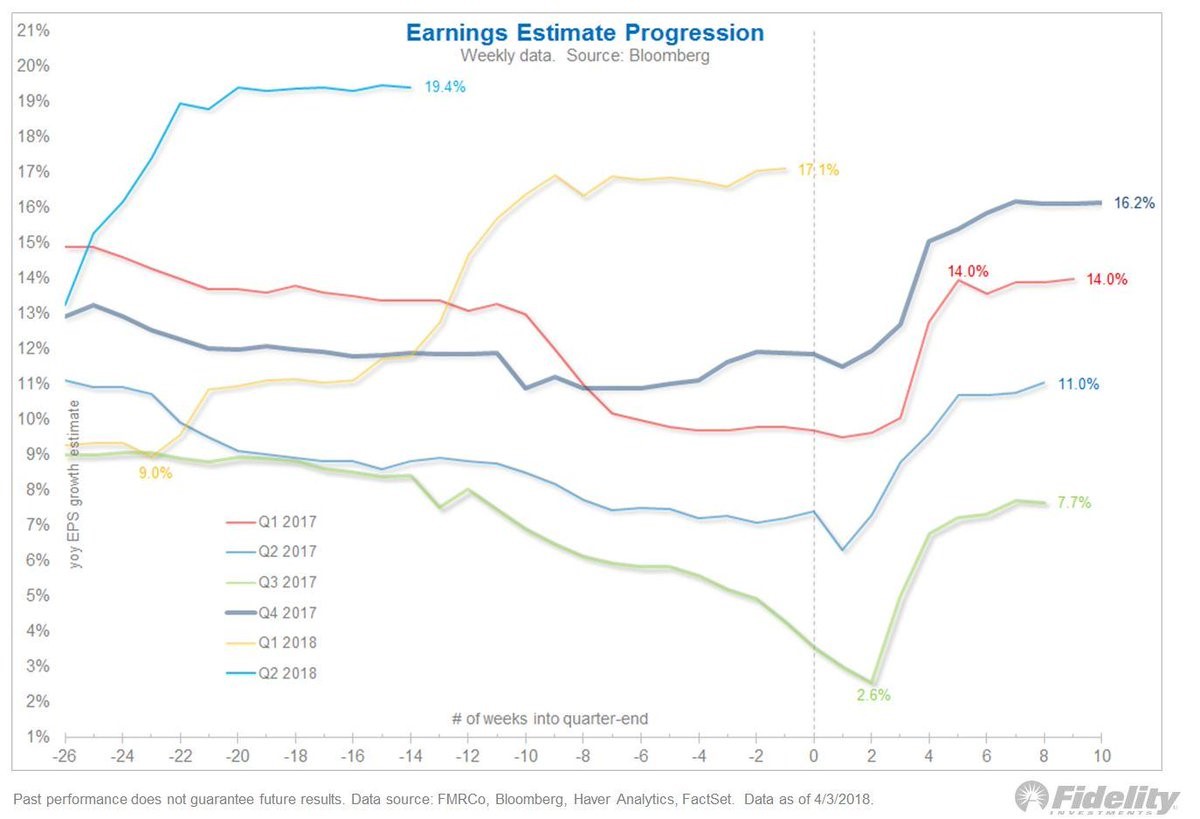
While there are logical criticisms of forward earnings estimates, they are irrelevant in 2018 because the year looks about as good as it can get. The earnings growth is expected to be 17.3% in Q1 which is the highest growth rate since Q1 2011 when the economy was just getting out of the recession. The year over year comps Q1 2011 had to face were much easier than the comps Q1 2018 is facing. Supporting these great results, is great guidance. 105 firms have issued guidance for Q1. 52 have issued negative guidance which is about 50% of firms. This is actually good news because usually firms issue negative pre-announced guidance. The 5 year average is for 74% of firms to pre-announce below estimates. The 53 firms issuing positive guidance is the highest total since at least Q2 2006 when FactSet started tracking EPS guidance.
The chart below shows the historical trend in earnings estimates.
Usually earnings estimates fall as the quarter gets closer. There is a sharp lowering of the bar right before results come out so firms “beat” estimates. So far, this hasn’t been the case for Q1 2018 estimates even after the results were pushed higher in January as analysts included the effect of the tax cut. The bar is high; the Q1 results will be critical to how the stock market performs the rest of 2018.
As long as the economy avoids a recession in 2018 as we expect, the 2018 earnings look great. The market has seen multiple contraction as earnings estimates have increased while stocks have fallen during the correction. If earnings can beat the high bar set for them, it’s hard to see this correction lasting much longer. It’s important to understand how fundamentals affect multiples. The forward multiple likely won’t reach the same level seen in 2017 because there won’t be another huge boost to earnings estimates which the tax cut already provided.
Have comments? Join the conversation on Twitter.
Disclaimer: The content on this site is for general informational and entertainment purposes only and should not be construed as financial advice. You agree that any decision you make will be based upon an independent investigation by a certified professional. Please read full disclaimer and privacy policy before reading any of our content.

