UPFINA's Mission: The pursuit of truth in finance and economics to form an unbiased view of current events in order to understand human action, its causes and effects. Read about us and our mission here.
Reading Time: 4 minutes
There are many bearish investors claiming that the economy is already in a recession. They support this by claiming that the NBER is late to announcing recessions. They are correct. By the time almost every investor knows the economy is in a recession, it’s probably time to start buying not selling. The NBER usually doesn’t recognize recessions until most traders have already sold.
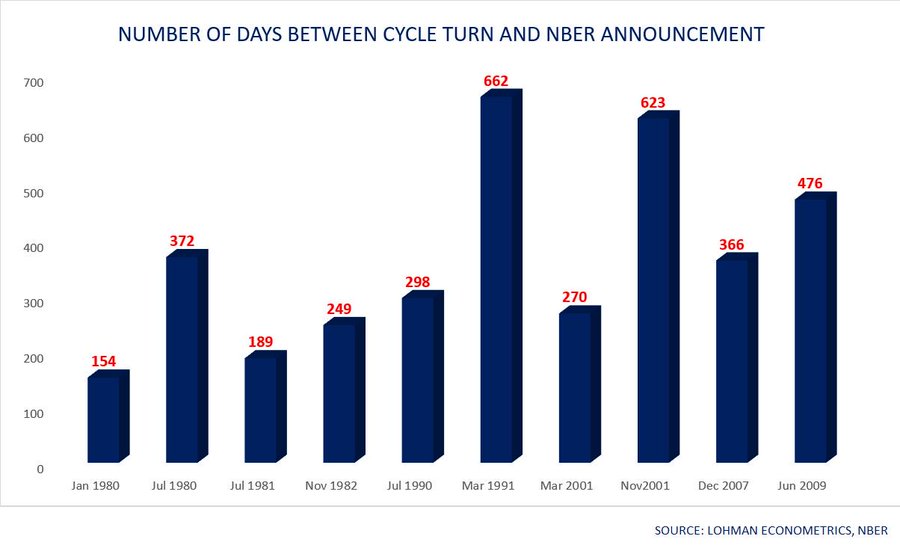
NBER About 1 Year Too Late
As you can see from the chart below, it took 366 days from the start of the last recession for the NBER to recognize it. If it wasn’t a long recession, it would have been over by then.
The chart also shows that it takes a long time for announcements that an expansion started. There’s not a bullish or bearish bias here.
While the bears are correct not to trust the NBER with timing the stock market, they are incorrect in their premise that there is always a recession coming soon or that there is one ongoing when the cyclical data slows. That logic has been wrong for almost 10 years. Just because recession announcements are delayed and GDP can be adjusted lower, doesn’t mean you can throw out all the data and claim a recession is ongoing. The stock market, jobless claims, new home sales, existing home sales, and the unemployment rate don’t suggest a recession is here. GDP growth below 2% isn’t a recession since the Fed suggests the long run growth rate is near 2%.
Very Weak Business Confidence
One of the most bearish charts going around is CEO confidence. As you can see in the chart below, the CEO confidence index as measured by Conference Board is the lowest since Q4 2008 and its yearly growth rate is the lowest since Q2 1979.
CEOs aren’t optimistic about the next 6 months for the economy. This survey is consistent with the relatively weak PMIs. The ISM manufacturing and non-manufacturing PMIs in September were consistent with 1.5% and 1.4% GDP growth. Growth is expected to be 1.7% in Q3, but keep in mind soft data is pushing estimates lower. The economy is in a cyclical slowdown, but CEO confidence is acting like it’s potentially in a recession.
This speaks to a point we made in a previous article. Goldman Sachs’ current activity indicator would show 0.4% growth if it only included survey data. It would have 2.5% growth if it only included hard data (it’s 1.3% overall). Growth is slowing, but there is no recession. Consumer confidence in the labor market fell, but the unemployment rate is the lowest since 1969, job cuts in September were the 2nd lowest of the year, and jobless claims are near their cycle low. The elephant in the room that is causing uncertainty is the trade war.
Divergent Recession Odds
There are many recession odds charts. We have shown the odds using the ISM PMI, the yield curve, and the unemployment rate. The chart below uses the yield curve and the excess bond premium.
The yield curve predicts a recession in the next year since it inverted. If it’s correct, there will be a recession when the curve steepens. The excess bond premium shows there’s low risk of a recession in the next year. It did have a false reading in late 2015 and early 2016 like many indicators did since that was a slowdown.
To be clear, the excess bond premium measures risk taking in corporate credit. The EBP measures the variations in the pricing of corporate credit risk instead of the changes in the probability of default by the issuer. The model built by Gilchrist and Zakrajšek uses secondary prices of unsecured bonds. A synthetic security was created to measure the bonds’ cash flows to avoid duration mismatch.
Improving Cyclical Economy
While the global economy looks grim, it’s not incorrect to look for green shoots. A global cyclical recovery could occur in 2020 especially since global central banks have been cutting rates (India has also cut taxes).
The chart below highlights the 3 slowdowns in the global manufacturing PMI since the 2008 recession. As you can see, the manufacturing PMI rose from 49.5 to 49.7 in September. We’d like to see it above 50 before making any assertions about a turnaround.
The new orders index increased 0.4 to 49.4 and new export orders increased 0.6 to 48. These readings are all in contractionary territory. The 3 strongest countries were Greece, Brazil, and Myanmar. China, India, and America were all above 50. The 3 weakest were Austria, Czech Republic, and Germany.
On the other hand, business activity in the global services PMI fell from 51.8 to 51.6. The new business index fell 0.5 to 51.4 and new export business fell 0.7 to 48.8. This caused the output composite to fall 0.1 to 51.2. It needs to be below 50 before we see a global recession.
Earnings Update
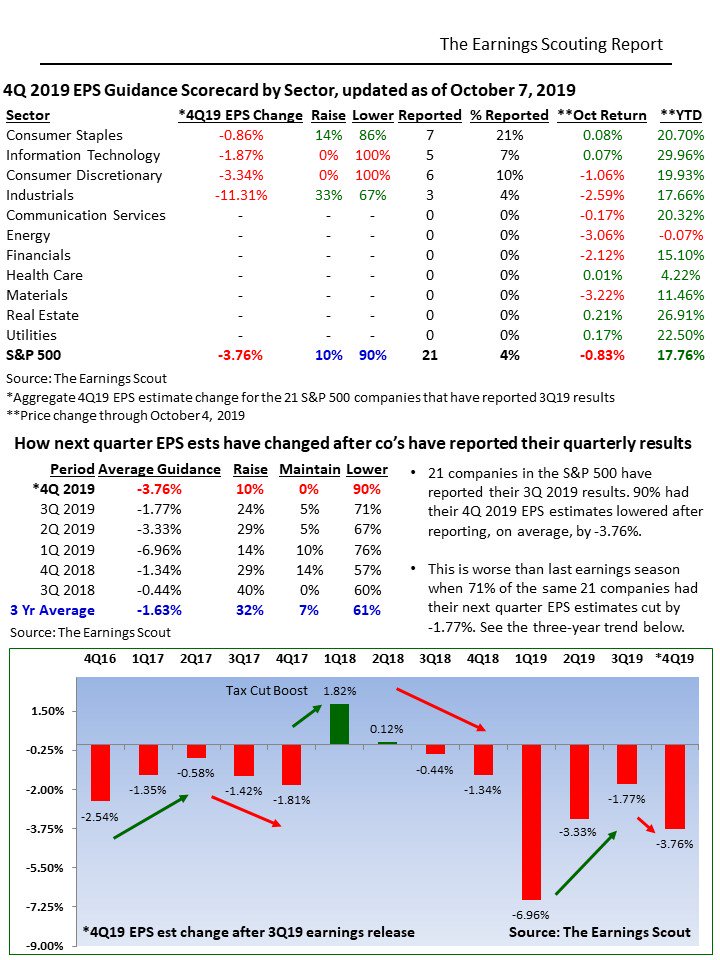
Earnings season will heat up next week as the major banks report results. So far, it doesn’t look good as the table below shows.
The average impact on Q4 estimates from the first 21 firms to report Q3 earnings was -3.76%. That’s worse than the 3 year average of -1.63% and worse than last quarter’s decline of 1.77%. It’s still too early to tell how earnings season will go with just 4% of S&P 500 firms reporting results. If these changes to Q4 estimates continue, the stock market will decline. Q3 and Q4 will still show positive growth, but it will be weak. So far, 86% of these firms have beaten EPS estimates on 2.9% growth and 57% have beaten sales estimates on 3.12% growth. 76% of firms have reported positive EPS growth.
Conclusion
The NBER is late to call recessions, but that doesn’t mean the economy is in one. This is likely the longest expansion since the 1800s. CEO expectations for the next 6 months of economic growth are very low probably because of the trade war. The yield curve signals a recession is coming, but the excess bond premium doesn’t. The global manufacturing PMI rose, but the services PMI fell. The first 21 firms have had positive EPS growth, but have caused Q4 estimates to fall more than average.
Have comments? Join the conversation on Twitter.
Disclaimer: The content on this site is for general informational and entertainment purposes only and should not be construed as financial advice. You agree that any decision you make will be based upon an independent investigation by a certified professional. Please read full disclaimer and privacy policy before reading any of our content.


