UPFINA's Mission: The pursuit of truth in finance and economics to form an unbiased view of current events in order to understand human action, its causes and effects. Read about us and our mission here.
Reading Time: 4 minutes
It’s tough to explain how unusual this recent run in markets has been because everything has been unusual this year. If something normal happened, it would be a shocker. In fact, that’s why some casual observers are shocked by the S&P 500’s relatively normal return year to date. It’s up 0.27% this year, which isn’t that far less than usual. It’s especially surprising considering the global pandemic and double digit unemployment rate.
The chart below shows how weird the recent action has been. A portfolio with a quarter in cash, stocks, bonds, and gold (each) just had its best 90 day run ever. It is up 18%. That’s because the tech stocks and gold have increased due to the decline in real yields. This portfolio seems diversified, but it picks up on the strongest trends of the past few months.
All Asset Movements Come From The Same Catalyst
Gold and the S&P 500 hit record highs in the same year for the first time since 1979. The cloud stocks look a lot like the gold mining stocks as both have gone vertical. Specifically, the CLOU cloud stock ETF is up 75% and the GDX gold mining ETF is up 131% since its March bottom. Many individual traders are living in their own micro world and missing the macro picture. These investments are widely different, but they have become correlated because of the decline in yields.
As you can see from the chart above, recently the decline in real yields has picked up steam in relation to nominal yields which implies inflation recovered. Inflation is bad for tech stocks, so that’s something to watch. Individually these 2 groups have reached a slew of unusual records and firsts in a long time. For example, the Nasdaq 100 beat the broad based Russell 3000 stock index 9 months in a row which ties the 2000 record. At least the spread of outperformance isn’t as large as it was in the late 1990s. 75% of GDX index members hit 52 weeks highs. In the past 26 years, this only happened in 2016. Gold call option volumes hit the 2nd highest level ever last week. The Nasdaq 100’s 20 day moving average has risen 75 days in a row which is the 6th longest streak since 1985. The longest is 89 days a few months ago. The GLD, IAU (both gold), and SLV (silver) all were in the top 5 of weekly fund flows last week.
No Rate Hikes In A Long Time
One of the main justifications many investors are giving for high stock multiples is not only are rates low, but they will be low for a long time. Some economists are already forecasting that the Fed won’t hike rates until 2025. Last expansion was unprecedented as many investors and economists kept predicting rates to rise. The Fed took years before finally obliging. The difference now is investors are very confident the Fed won’t hike rates. Future estimates are different from last cycle causing many to raise the price they would pay for stocks.
The table above shows when surveyed market participants expect rates to be hiked. As you can see, the median estimate is for a 4.5% unemployment rate and a 2.1% core PCE inflation rate. The economy is very far from that unemployment rate as it may have risen from the 11.1% rate in June. In May, core PCE inflation was just 1%. In the past 10 years, there have only been 4 months where core PCE inflation has been at or above 2.1%. Clearly, expectations are for no rate hikes anytime in the next few years. Inflation will rebound from the trough this spring, but that likely won’t be enough for core inflation to get near these targets.
Fed Programs Haven’t Been Utilized
The Fed’s policies have been exaggerated or guidance is extremely powerful. Those are the only two potential conclusions you can make when looking at markets and the chart below. As you can see, the Fed’s new emergency programs to support the market have hardly been tapped. Either private firms have lower borrowing costs elsewhere or the programs have been expensive and complicated to use.
To be clear, if there was an impending issue with a major corporation, the Fed would do whatever it takes to solve that problem. The public equity and bonds markets are working fine partially because the Fed is willing to do anything. The problem is how this trickles down to small businesses. They are hurting. 71% have used their entire PPP loan and 20% expect to layoff employees. About half will need more money in the next year and 22% think they won’t last for the next 7-12 months. Money isn’t the only issue. If sales are diminished because of COVID-19 indefinitely, there is no motivation to get back to business (in some places it’s illegal).
Brutal Conference Calls
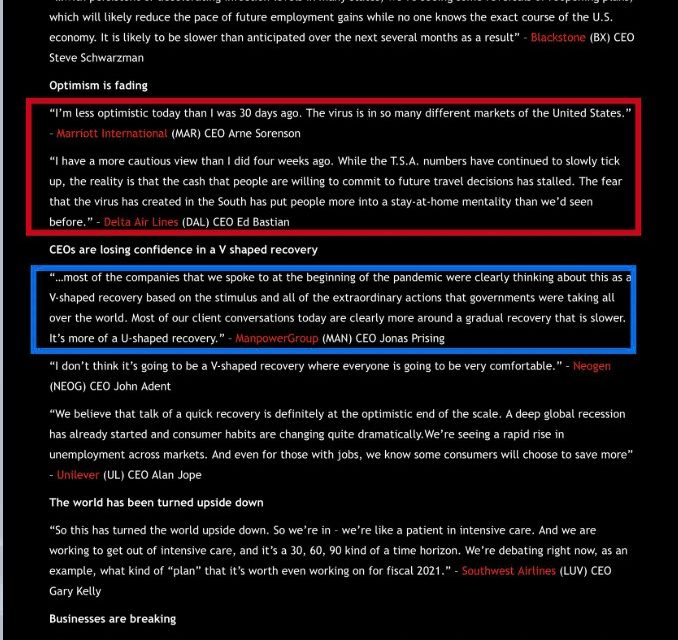
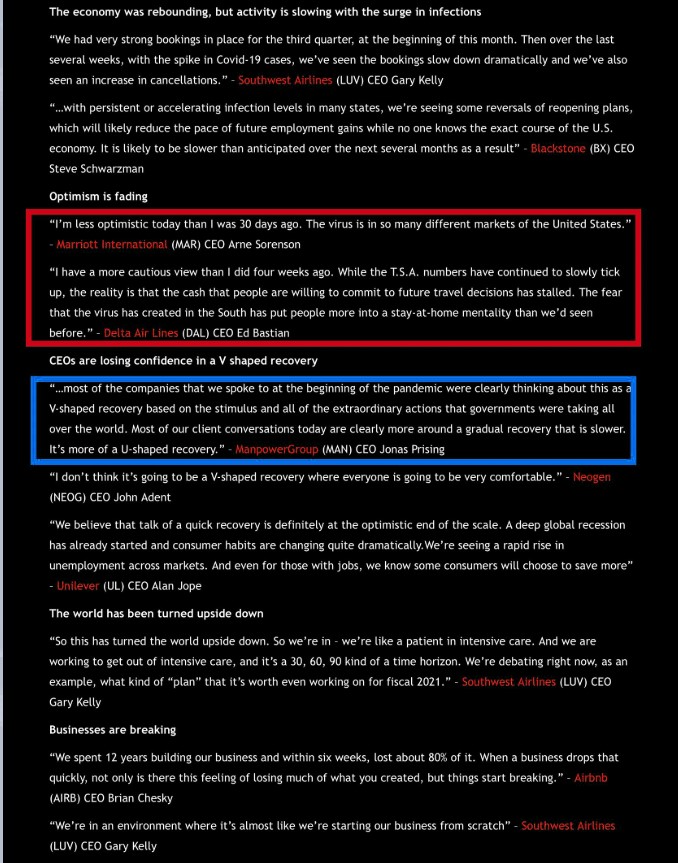
This earnings season is a lot different from the last one. Guidance is the most important aspect of earnings season. Heading into Q1 earnings season, investors expected terrible guidance because Q2 is when most of the weakness due to COVID-19 occurred. However, investors were pleasantly surprised when firms showed how the trends were improving in the 2nd half of April and May. Now we are in Q2, so you’d think firms would be more optimistic knowing that the worst is behind them. However, many firms are gloomy because the economy weakened in July (different from its improvement in April).
The graphic above shows a few management quotes from this quarter. The Marriot CEO is less optimistic than he was 30 days ago. Manpower Group CEO said he no longer discusses V shaped recovery expectations with clients. Now they see a U shaped gradual recovery. That’s because of the recent weak data.
Conclusion
A diversified portfolio of gold, cash, bonds, and stocks just had its best 90 day return ever. Real yields are at a record low. Investors expect zero Fed rates for a few years. The hyped V shaped recovery is gone. Now firms are hoping for a U shaped recovery. That’s likely already priced in through the decline in yields and weakness in value stocks. We’ve been discussing this cyclical slowdown for about 6 weeks.
Have comments? Join the conversation on Twitter.
Disclaimer: The content on this site is for general informational and entertainment purposes only and should not be construed as financial advice. You agree that any decision you make will be based upon an independent investigation by a certified professional. Please read full disclaimer and privacy policy before reading any of our content.


