UPFINA's Mission: The pursuit of truth in finance and economics to form an unbiased view of current events in order to understand human action, its causes and effects. Read about us and our mission here.
Reading Time: 4 minutes
We asked on Twitter whether the stock market was properly pricing in the current recession. 72.8% said ‘no’ and 27.2% said ‘yes’. That was out of 353 voters. The people who said ‘no’ were likely looking at the overall index from a top down perspective. They should recognize the position sizing of the market cap weighted index. The top 5 tech firms which are Amazon, Apple, Facebook, Microsoft, and Alphabet control over 20% of the index. They have done well or at least better than most firms during this recession. Plus, they have no liquidity needs. As the chart below shows, they have dramatically outperformed the bottom 495 firms in the index.
The S&P retail ETF is down 22.23% from its February high which shows the market is worried about the shutdowns for the companies most effected by it. The companies that are both directly impacted by the shutdown and have financing problems are down at least 70%. An example of this is AMC.
With this concept in mind, let’s look at the current market compared to 2008 and 2009. This market is arguably in better shape. Since then, the S&P 500 has lost $49 billion in earnings power from two energy companies which are Chevron and Exxon Mobile. Energy has the lowest weighting in the index in decades. That’s probably a good thing because energy is highly cyclical. Some are arguing that also means energy is a buy. The situation is certainly close to as bad as it can get for the sector as Shell cut its dividend for the first time since the 1940s and oil prices hit a record low (negatives for a short time).
On the other hand, the S&P 500 has gained $106 billion in earnings power from 4 tech stocks that have secular growth trends in their favor. They are Alphabet, Apple, Microsoft, and Facebook. Alphabet and Facebook are reliant on ad spending, but digital spending took share from other mediums like TV in this recession as advertisers wanted the most bang for their buck. Also keep in mind, online sales did the best. Online companies are more likely to advertise on Facebook and Google than TV. Because of this shift away from energy and towards big tech, the S&P 500 has higher quality. It’s becoming similar to the Nasdaq. Instead of looking at the chart that shows the size of the largest companies and unilaterally deciding these companies are too big, look at their wide competitive advantages. They won’t be easy to beat unless the government gets involved and decides they are monopolies.
Sector By Sector Relative PE Multiple
The table below indicates the stock market is too expensive on its surface, but let’s take a deeper dive. As you can see, all sectors but two have a higher PE ratio than their 25 year average.
The first thing to keep in mind is energy isn’t included because it probably will have terrible earnings because of the decline in oil prices. This sector is extremely cheap when compared to peak cycle earnings. You can’t look at trough earnings because those are unsustainable. Cyclical stocks look expensive at bottoms and cheap at tops. That’s why you need to model out a cycle. For example, you can suppose WTI oil hits $55 at the peak of the next cycle and work from there. Companies with huge debt positions won’t benefit as much from the cyclical upturn as those without debt. On the other hand, those with financing risk will see their stocks rise the most if oil prices rise allowing them to avoid bankruptcy by the skin of their teeth.
It’s also notable that interest rates are lower now than at any point in the past 25 years. Furthermore, the Fed is buying corporate debt. The stock market does the best when the unemployment rate is high and falling which is likely what we will see over the next few months. High unemployment means lower pay for workers and higher margins. Falling unemployment means increasing demand which means higher sales.
Remember, the healthcare sector is bifurcated. You have health insurance companies benefiting from the decline in elective surgeries and biotech firms searching for a cure for COVID-19. It’s notable that in this table, the consumer discretionary sector has an 8 point higher PE than normal. That’s because of Amazon which really isn’t a consumer discretionary name. It’s really a tech stock because it derives most of its profits from Amazon Web Services which is its Infrastructure As A Service (IAAS) cloud offering.
Future Returns Look Good
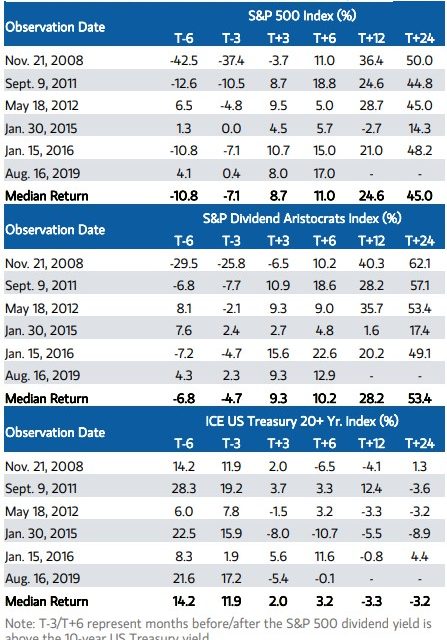
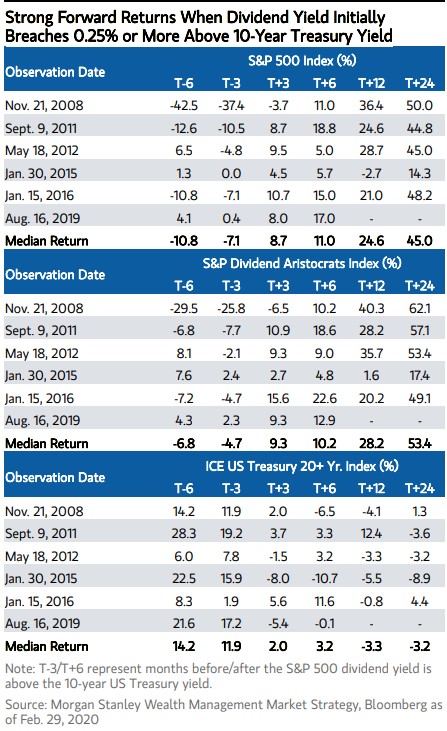
As we mentioned, low rates may be helping valuations. Let’s look at low rates as a catalyst for stocks. As you can see from the top table below, when the S&P 500’s dividend yield initially breaches 0.25% or more above the 10 year treasury yield, the median return in the next year is 24% and the median return in the next 2 years is 45%. Only in 2015 did stocks fall in the next year.
The returns are even better for dividend aristocrats. The median gain is 28.2% in the next year and 53.4% in the next 2 years. On the other hand, treasuries don’t do well. The ICE US Treasury 20+ year index falls 3.3% in the following year. Treasuries are only a good investment now if you foresee negative rates. They need to fall significantly negative for them to be a good investment over the long term which is unlikely. Because yields are so low, instead of bonds, people are using cash to diversify from stocks.
Conclusion
Stocks are pricing in the recession even though the index has done very well. It’s up because the major tech stocks have driven it higher. The market is probably safer because they are so important since they have wide moats and aren’t as cyclical as energy stocks. Most sectors are more expensive than average, but rates are low and the Fed is very dovish. The high unemployment rate and the fact that the S&P 500 now yields significantly more than the 10 year yield are great for stock market performance. Some investors are eschewing treasuries completely because their yields are so low.
Have comments? Join the conversation on Twitter.
Disclaimer: The content on this site is for general informational and entertainment purposes only and should not be construed as financial advice. You agree that any decision you make will be based upon an independent investigation by a certified professional. Please read full disclaimer and privacy policy before reading any of our content.


