UPFINA's Mission: The pursuit of truth in finance and economics to form an unbiased view of current events in order to understand human action, its causes and effects. Read about us and our mission here.
Reading Time: 4 minutes
With stocks on a high note, it’s easy to see numerous potential catalysts that could throw it into a correction. However, it’s up to investors to determine which potential catalyst has a negative enough expected value to end this great streak. One potential negative catalyst the stock market is ignoring is Bernie Sanders’ increasing odds of winning the Democratic nomination. Bernie Sanders has strong grassroots support as evidenced by the fact that he raised the most money in Q4 2019 and had 1.8 million individual donors. He raised $34.5 million in Q4 which was much higher than his Q3 total of $25.3 million.
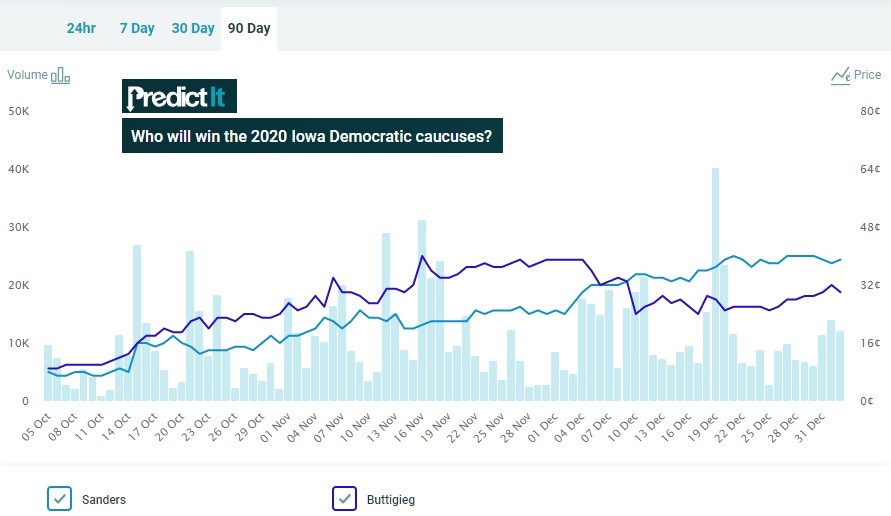
Yes, Bloomberg has almost unlimited money to spend on a relative basis, but that’s pushing on a string without strong supporters. Money raised is a strong signal of the health of a campaign. Bernie raised the most which could be scary for investors as he is a left leaning candidate. Markets would much prefer Buttigieg and Biden (moderates) who raised $24.7 million and $22.7 million, respectively. (Warren raised $21.2 million which was down from $24.6 million). The other strong point for Bernie is he leads the betting odds for the first two states. As you can see from the chart above, Bernie has a 40% chance of winning Iowa and Buttigieg is at 30%. In New Hampshire, Bernie has a 52% chance and Biden is at 19%. In the average of recent national polls, Biden is ahead of Bernie by 9.2 points as his average is 28.3%. Sanders is in second at 19.1%. Warren and Buttigieg are at 15.1% and 8.3%.
Minimum Wage Hikes
The national minimum wage has been stuck at $7.25 since 2009, but there have been hikes in states and cities since then which have helped low income wage growth. Minimum wage hikes lower the number of jobs, but in this labor market there are excess openings, so that’s not an issue. In a recession, these minimum wage hikes will have more negative effects because there won’t be as many jobs available. Politicians might lower or delay hikes to avoid some of these consequences.
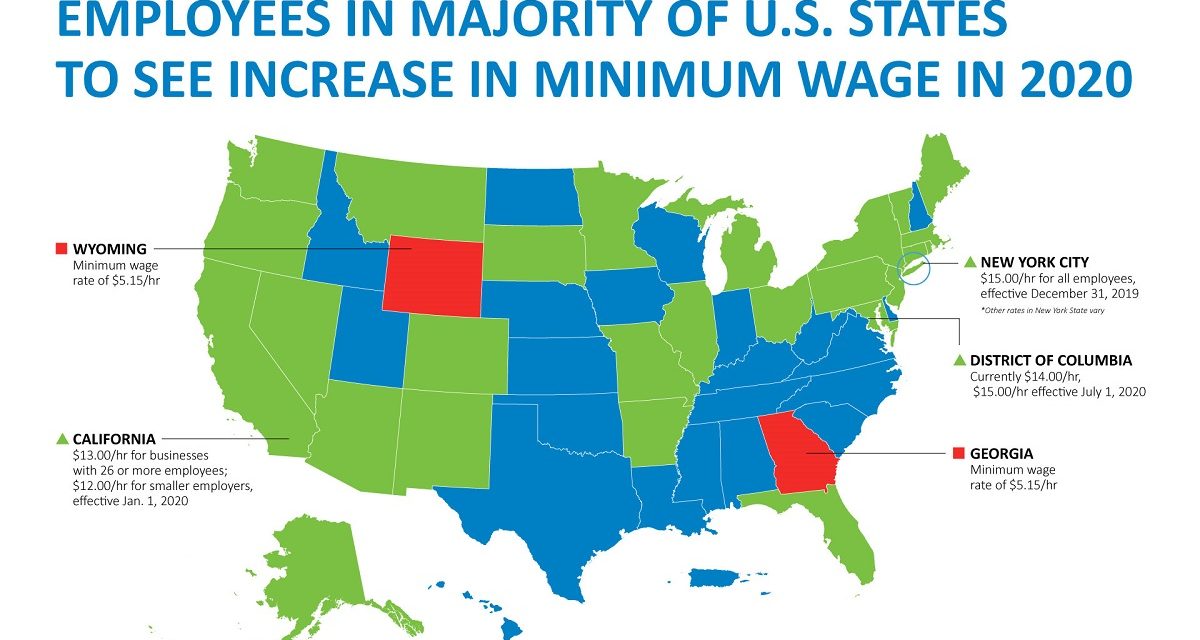
Focusing on 2020, low wage earners are about the get a pay bump which will add to their already high wage growth. Maybe they can outperform for longer than usual because of this or this could force employers to cut back. The map above indicates where there were increases in the minimum wage by showing the state colored in green. Blue means no hike. Red is for Georgia and Wyoming which have the lowest minimum wage which is $5.15. The minimum wage was hiked in 21 states and 26 cities and counties. 17 cities and counties will reach a minimum wage of $15 or more.
In California, the minimum wage went from $11 to $12 for small employers and from $12 to $13 for large employers. In New York City, it stayed at $15 for large employers and increased from $13.50 to $15 for small employers. In Long Island it increased from $12 to $13. In upstate NY, it went from $11.10 to $11.80. For fast food workers in NYC it stayed at $15. For the rest of the state, it rose from $12.75 to $13.75. The highest across the board minimum wage is $16.05 in Mountain View and Sunnyvale California. The highest for large firms is $16.39 in Seattle. The wage hikes don’t stop at the start of the year. 4 states and 23 cities and counties will raise the minimum wage later in 2020. 15 cities and counties will be above $15.
Low Job Cuts In December
The jobless claims and job cuts reports provided more good news for workers. In the week of December 28th, jobless claims fell 2,000 to 222,000. The 4 week average rose from 228,500 to 233,250 because of the spike related to the timing of Thanksgiving. The 4 week average is the highest since January 2018. The 4 week average should decline in the next report when the spike is removed from the average.
As you can see from the chart below, the number of job cut announcements in December fell from 44,569 to 32,843. That’s a 25.2% decline from last December. Total job cuts in 2019 were 592,556 which was 10% higher than in 2018. The increase occurred because of the spike in Q1. Since the start of the expansion, this was the 4th highest yearly total. The other 2 slowdowns in this expansion are clear by the number of cuts as there were 598,510 in 2015 and 606,082 in 2011. The most was in 2009, but that shouldn’t count because the first 6 months were recessionary.
Bankruptcies were attributed to by far the highest percentage of job cuts since 2005. 10.49% of cuts in 2019 were related to bankruptcies, primarily from retailers. The next closest percentage was 6.92% in 2005. Retailers actually had fewer cut announcements in 2019 than in 2018 though. Cuts fell from 98,563 to 77,475. Brick and mortar general merchandise sales as percentage of total retail sales have fallen so much, they are closing in on insignificance. Many big retailers such as Target and Wal-Mart have successfully adjusted to the new landscape by selling items online for instore pickup.
On the other hand, tech had a big increase in cuts as they were up from 14,230 to 64,166. The biggest percentage increase was in mining as cuts increased 1,293% to 8,135. Legal cuts fell to 0. The region with the biggest increase in cuts was the South which had cuts rise 32.6%. Finally, there were 26,313 announced hires which was up from 15,999 last December. In 2019 hires increased from 1,018,428 to 1,207,751.
Conclusion
Bernie Sanders raised the most money out of all the Democratic candidates in Q4, yet the market doesn’t take his odds of winning seriously. There was a slew of minimum wage hikes at the start of 2020 and there will be some more later in the year. This is great for low wage workers. Jobless claims and job cut announcements were low. The 4 week average of claims should be ignored as that spike in early December will come out of the average next week. Hiring announcements increased in December.
Have comments? Join the conversation on Twitter.
Disclaimer: The content on this site is for general informational and entertainment purposes only and should not be construed as financial advice. You agree that any decision you make will be based upon an independent investigation by a certified professional. Please read full disclaimer and privacy policy before reading any of our content.


