UPFINA's Mission: The pursuit of truth in finance and economics to form an unbiased view of current events in order to understand human action, its causes and effects. Read about us and our mission here.
Reading Time: 4 minutes
2019 was an extreme year for markets as almost the entire rally was based on multiple expansion (S&P 500 rose 27.76%). Either stocks started 2019 cheap or economic reports and monetary policy enticed investors to pay up for companies. You can see in the chart below in 2018 earnings improved dramatically, while stocks fell, which made for sharp multiple contraction. Therefore, stocks played catchup in 2019 and were helped by Fed rate cuts. Stocks rallied even though there was some weakness in the economy.
Based on the relatively high valuations stocks started 2020 with, it was fair to say if earnings didn’t increase (which they were expected to), stocks wouldn’t increase. There was little room for multiple expansion. Even though it seemed like stocks couldn’t get much more expensive without reaching extreme levels, stocks rallied in the first 2 months of the year.
Obviously, we all know what happened next. Stocks fell 34% because of fears of COVID-19 and because of the unprecedented global economic shutdowns. Stocks hate uncertainty. This was the most uncertain period in modern history. Therefore, there was major multiple contraction. With the recent rally in stocks which is 31.38% as of April 29th, we have now seen multiple expansion again. It has occurred in an unexpected way as stocks are down 9.02% year to date, but earnings estimates are down much more.
Even though it sounds bad that stocks are in the same predicament as February, optimists claim stocks are always expensive when compared to trough earnings. We much look towards 2021 they say. It’s also possible, but not likely that estimates are much too negative. While we think the rate of change of the EPS estimate declines is peaking as we discussed in a previous article, it’s unfair to go as far as to say estimates won’t fall further and firms will beat those estimates. Remember, that we are referring to the overall market. There are individual companies that are cheap and expensive. In extreme circumstances like this bear market, everything trades together. However, in the long run individual company fundamentals will matter.
The Precedent For A Quick Bear Market
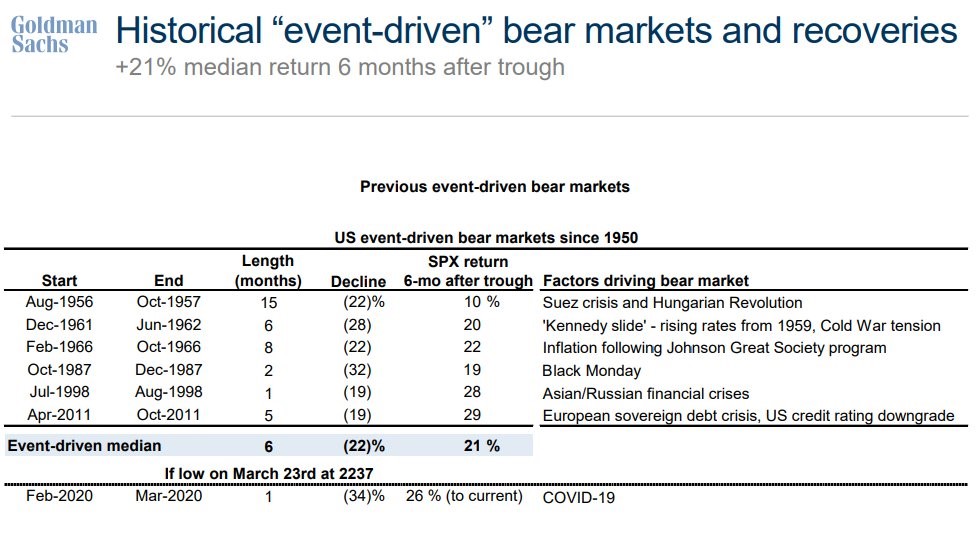
This situation is unprecedented in a lot of ways. Even though the government and populace could be doing a better job than they have, let’s not forget that the human race has made immeasurable progress in fighting diseases over the past few decades. This situation is an exogenous event which means it came from outside the economy. It’s not like the financial crisis which came from a housing bubble. These event driven bear markets tend to be resolved quickly and don’t tend to cause as much damage to equity prices. It’s not surprising that this was the worst event driven bear market since at least 1956 because the economy is facing its sharpest downturn since the Great Depression. Many economic data points like the unemployment rate might end up being worse than the worst point in the Great Depression, but the recovery will be much quicker.
As you can see from the table above, event driven bear markets cause an average loss of 22% and last 6 months. The worst was October 1987 in which stocks crashed in part due to portfolio insurance that didn’t work. Some compare that mishap to this bear market by saying passive investing caused this decline. We’ve already discussed in an article that passive investors didn’t sell. A better comparison to portfolio insurance was the short VIX blow up of early 2018. Getting back to this year’s bear run, it is tied for the shortest length as it was 1 month. Furthermore, stocks usually rally sharply after these declines because shocks are temporary. Stocks rally 21% on average in the next 6 months after the bottom, with the largest rally being 29%. As we mentioned, stocks are already up 31.38% since March 23rd. That’s more than 6 months worth of gains in 1 month. This has been a V-shaped decline and recovery so far.
Sentiment Is Confusing
This is a hard market to gauge because most investors think stocks are too expensive, yet they continue to rally. There isn’t extremely positive sentiment even though stocks have had their 3rd best month since WWII (April up 12.8%). The AAII investor sentiment survey shows there are fewer than average bulls (30.6% which is 7.4% below average) and the CNN fear and greed index is at 46 which is neutral. The NAAIM exposure index rose from 45.34 to 78.55 which implies active managers have chased this rally and are bullish. That was one of the largest increases in history as the index is the highest since the 3rd week of February. The stock market is causing indicators to conflate because it fell and rallied so quickly. This brings us to the non-traditional data which we have leaned on this entire bear cycle.
The chart above shows TD Ameritrade daily active client trades. They were hovering below 1 million for a few months before exploding to nearly 3 million after the company cut commissions to zero. This might have had a psychological impact. Stocks certainly went on an amazing run when they were trading actively in December, January, and February. You can say this signaled froth in the market. That being said, trading activity has ramped much higher in this bear market as investors are buying the dip in what seems like everything.
The chart below shows the daily active revenue trades increased from about 1.5 million to 5 million in the span of a few weeks at E-Trade, TD Ameritrade, and Charles Schwab.
We know that Robinhood also had record signups. This has been a perfect storm for these platforms as retail traders love to buy the dip, they are home all day so they have time to spare, trading commissions are zero in most cases, and markets have been moving fast. Keep in mind, these traders aren’t all bullish. Some retail traders are betting against the market.
Conclusion
There has been multiple expansion in 2020 even though stocks started the year with high multiples. This rally is part of the trend of stocks doing well quickly following bottoms caused by exogenous events. This has been the deepest decline and sharpest recovery out of the exogenous shocks since the 1950s. There was a massive spike in trading activity after TD Ameritrade cut trading fees to zero. That’s not the only broker with increased activity. They all have seen spikes as retail loves to buy the dip and people have extra time at home now that they can’t go to work.
Have comments? Join the conversation on Twitter.
Disclaimer: The content on this site is for general informational and entertainment purposes only and should not be construed as financial advice. You agree that any decision you make will be based upon an independent investigation by a certified professional. Please read full disclaimer and privacy policy before reading any of our content.


