UPFINA's Mission: The pursuit of truth in finance and economics to form an unbiased view of current events in order to understand human action, its causes and effects. Read about us and our mission here.
Reading Time: 4 minutes
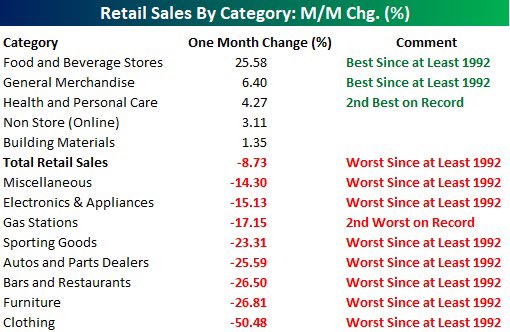
Retail sales were down huge in March. They will fall even more in April. We know based on private data that there was excessive hoarding in mid-March; grocery store sales growth fell in the following weeks (into April). That could help drive retail sales growth lower since food and beverage stores were the biggest winners in March. As you can see from the table below, monthly food and beverage store sales growth was 25.58% in March. The hoarding took place in the middle of March when the shutdowns where starting. Grocery store sales growth is dwindling as people realize how much they actually consume and utilize the hoard they purchased. This category’s sales explosion gave it the highest weighting in the report at 17%. That’s usually motor vehicles and parts.
Headline monthly retail sales growth was -8.73% which missed the consensus of -7.3%. This is the worst monthly sales growth since at least 1992. Because of this easy comp, April growth might not be bad on a monthly basis, but it will be even weaker on a yearly basis. Food and beverages has a tough monthly comp is as we mentioned. Retail sales excluding autos weren’t nearly as bad, implying autos were weak. Sales growth was -4.5% which was slightly worse than estimates for a 4.2% decline. Autos and parts sales were down 25.59% which was also the worst since at least 1992.
Excluding autos and gas sales, monthly growth was -3.1% which beat estimates for -4.5%. Gas prices have crashed and few people are driving. WTI oil recently fell to the lowest price since February 2002. Monthly sales growth at gas stations was -17.15% which was the 2nd worst growth on record. Surprisingly, the control group had positive growth. Growth was 1.9% which destroyed estimates for -1.8%. It was way above the highest estimate which called for a 0.4% decline. This spells good news for GDP growth as it goes directly into that calculation.
Clothing sales fell 50.48% monthly. That’s no surprise because the stores are shut down. There is no need for new clothes when there are no social gatherings. The 26.81% decline in furniture sales is slightly surprising because there was a boost in work from home related furniture demand such as desks. On the positive side, online sales growth was 3.11%. This segment has a 14.24% weighting. It’s usually the 2nd biggest category, but it was the 3rd biggest in March because food and beverage sales spiked. March was the rare situation where general merchandise outperformed online sales as it had 6.4% growth which was over double online sales growth. General merchandise stores benefited from the trend of buying non-discretionary items like toiletries.
On a yearly basis, retail sales excluding food services growth was -3.8% which was better than the last recession’s bottom of -12.8% growth in March 2009. April will have worse yearly growth than that as we mentioned earlier. Since restaurants and bars were closed, yearly growth including food services was -6.2%. That’s much closer to the March 2009 trough of -11.5%. That trough will easily be surpassed by April’s report. Remember, OpenTable shows bookings have been down 100% since March 21st. Real yearly retail sales growth was -7.6% which was near the November 2008 trough of -11.4%. Yearly non-store retail sales growth actually increased from 7.7% to 9.7%. That explains all the hiring Amazon is doing to keep up with demand.
Housing Market Turns South
The housing market was doing really well headed into this recession because rates were low and we had a warm winter. Now, it’s basically non-existent since people aren’t going out. Social distancing doesn’t allow for open houses. People can’t afford to pay their mortgage let alone buy a house. That’s why the April housing market index fell from 72 to 30 which missed estimates for 60 and the lowest estimate which was 53. Builder confidence fell below 50 for the first time since June 2014. Anything below 50 is a decline. Somehow every economist believed housing would grow. They clearly aren’t bearish enough on housing. When they get too bearish, it’s usually a bullish sign.
The present sales index fell from 79 to 36 and the future sales index fell from 75 to 36. The prospective buyers index fell from 56 to 13. The table above shows that reading is in the 5.2nd percentile. What an amazing fall from grace as it was previously in the 95.9th percentile. It’s no surprise the Northeast was the worst hit as New York City and New Jersey are the worst hit areas by COVID-19. The region’s index fell from 64 to 19.
As you can see from the chart below, the March purchase applications index was down 24% yearly in the New York City metro area.
With this huge decline in the housing market index in April, purchase applications will be virtually non-existent in the area. There are more people who are deferring mortgage payments than looking to buy a new house. The current unemployment rate is about 15% if you look at jobless claims and extrapolate that out. According to Black Knight that will cause 5.5 million mortgages to go past due (10.3%).
Yearly applications growth was the worst in the Philadelphia area as it fell over 30%. In the Midwest, the housing market index fell from 67 to 25. The indexes in the South and the West, which are the first and second biggest regions, fell from 76 and 79 to just 34 and 32. The South is an area to look out for because Florida and Louisiana are emerging hotspots for coronavirus.
Conclusion
The retail sales report was terrible in March. Imagine how bad it was in April. On the other hand, somehow the control group did fine which means consumer spending shouldn’t crater Q1 GDP growth. As we showed in a previous article, the Redbook same store sales reading implies sales fell off a cliff at department stores and growth slowed at discount stores (both in the week of April 11th). That’s bad for Q2 GDP growth obviously. The housing market also fell off a cliff in April. The decline in traffic has been startling as you’d expect in an economic shutdown. It went from the 95.9th percentile to the 5.2nd percentile. There is no way this sharp fall can be repeated without such a shutdown.
Have comments? Join the conversation on Twitter.
Disclaimer: The content on this site is for general informational and entertainment purposes only and should not be construed as financial advice. You agree that any decision you make will be based upon an independent investigation by a certified professional. Please read full disclaimer and privacy policy before reading any of our content.


