UPFINA's Mission: The pursuit of truth in finance and economics to form an unbiased view of current events in order to understand human action, its causes and effects. Read about us and our mission here.
Reading Time: 5 minutes
We like to present the best bullish and bearish narratives and toss away the bad ones. We want to clarify the best reasons to go bearish or bullish. Obviously, only one side will be correct depending on your time frame, but if you’re going to be wrong, at least don’t lose money because of a faulty narrative. We’ve seen investors say that stocks are at the same level as “insert year here” which is bearish because the economy is worse than then. The obvious rebuttal to that is the unemployment rate is likely the highest since the Great Depression. Should we take stocks back to 1930s levels because the economy is the weakest since then? Obviously, we shouldn’t do that because companies have made enormous progress since then. The only companies that won’t recover from this recession are the ones with liquidity issues.
As we mentioned in a previous article, intrinsic value isn’t impacted much by a few quarters. The bulls are making the assumption that once this virus is over, most companies will get back to normal. The earnings recovery should be where the bulls battle the bears. Whether or not the economy is worse than it was a few years ago doesn’t matter. There are different circumstances in play now such as the expansive fiscal and monetary policy. If stocks simply went to where the economy was previously in a similar state, we would always see bear markets take away 100% of the bull market gains. It takes more analysis than that to forecast outcomes.
Government Opening Is One Step
If the government opens up the economy, it doesn’t mean everything will go back to normal until there is a treatment or a vaccine developed. The good news is we could see a vaccine developed by this fall. The bad news is the government reopening is just the first step; plus, if infections rise again, the government might need to reverse course. The situation is highly uncertain. It’s very tough to become knowledgeable on infectious diseases overnight since even the experts aren’t sure what will happen. Let’s stick with what we know and the facts.
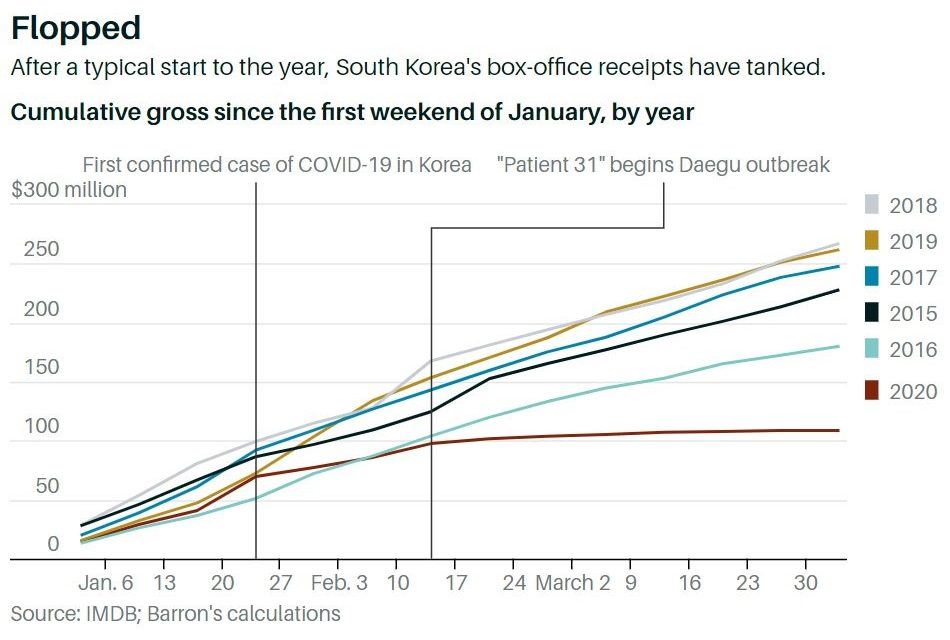
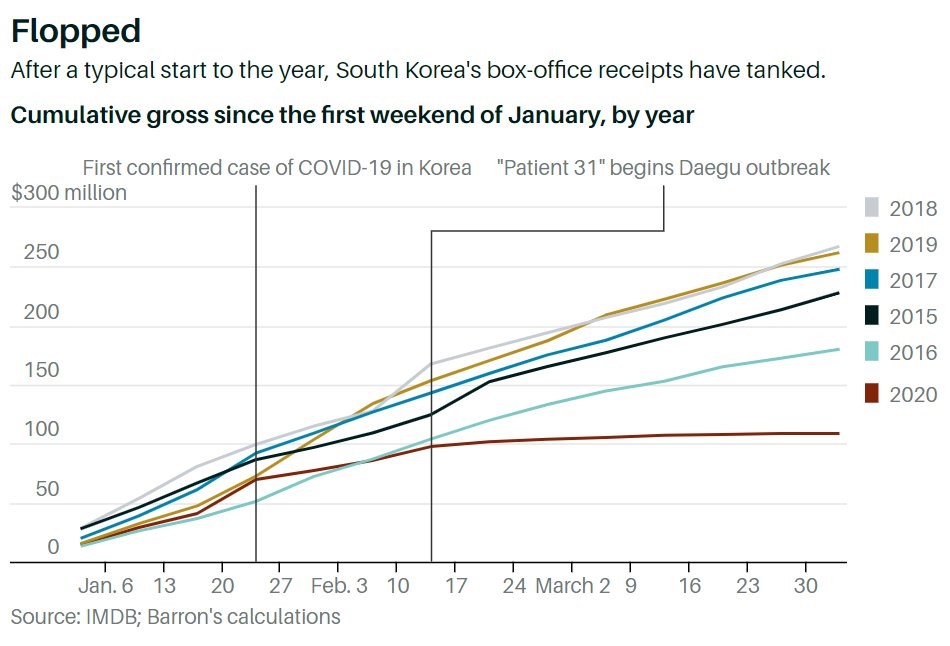
Even though South Korea has done well to contain coronavirus, movie attendance has flopped. On the other hand, foreign movies aren’t being released and some movie theaters have closed preemptively. There are multiple factors in play, but it’s fair to say the global economy won’t go back to normal after reopening unless there is treatment or a vaccine. Obviously, the thesis isn’t about movie sales; it’s about the entire economy. Google’s cellphone location data shows even though Taiwan never shuttered its economy, its people are 22% less likely to go to retail stores or recreation shops and are 28% less likely to use mass transit.
Leading Indicators Crash
In March the leading indicators index fell 6.7% monthly which beat estimates for a 7% decline. That was the best beat in over 8 years which is shocking because as you can see from the chart below, the monthly growth rate was by far the worst ever. That’s an example of economists getting too negative, which is a bullish sign.
To be clear, the leading indicators showing there is a recession afoot isn’t useful because we already knew this 4 weeks ago. Yearly growth in the leading indicators index was -6.5%. Weakness was broad based as you’d expect. Negativity came from unemployment insurance and stock prices. Monthly growth in April might not be much worse because of the easy comp and the rise in stock prices. However, yearly growth is very likely to be worse.
In the 6 month period ending in March, the leading index fell 6.6%. The coincident index only fell 0.3% in the past 6 months. That means the leading to coincident index ratio is strongly signaling a recession. In the week of April 11th, the ECRI leading index actually rose 4.5 points to 111.3 probably because of the rise in the stock market (nothing else got better). However, the growth rate fell 6.1 points to -42.5% which is its worst growth rate ever going back to 1968. Its nominal trough 2 weeks prior gave it its lowest reading since March 13th, 2009. Like the Conference Board report that we just described, the ECRI coincident index only just started to show weakness. In the month of March, the coincident index fell 3.5 points to 183.9 which sent the growth rate down 3.7 points to -2.4%. That’s its worst growth since October 2009 and the lowest index since December 2018.
Worst Drop In Consumer Comfort Ever
The Bloomberg Consumer Comfort index has fallen 18.5 points in the past 4 weeks; that’s the biggest 4 week drop by far since the mid 1980s as you can see from the chart below.
The 2008 financial crisis looks like a blip on the radar compared to this. We have already seen nearly a recession sized decline in 4 weeks. Most of the decline might already have happened. The stock market’s recent rise could help confidence. The economy reopening and progress on a treatment or vaccine could also improve confidence.
The index fell 5.4 points after a record 6.4 point drop in the prior week. Just like jobless claims, this index can’t fall at its recent rate for much longer because it would hit zero soon. It’s at 44.5 now. If it fell 6.4 points every week, it would be at zero in 7 weeks. The lowest it has been in its 34 year history is in the low 20s. We’d only have about 3.5 weeks of 6.4 declines to get there. Comfort is the lowest since October 2016. The economy is much worse than then which implies this index has some more room to fall. The unemployment rate in October 2016 was 4.9%. It is in the mid-teens now (based on initial jobless claims).
Within this survey, the economic sentiment index fell 7 points to 37.4. Its 10.6 point drop in the previous week was the biggest ever. The buying climate index fell 5.9 points to 37 which is its lowest reading since December 2015. The personal finance index fell 12.1 points to 59.1 which is a 2 year low. Comfort is at a 3 year low for Republicans. It’s the lowest since January 2017 for Independents and the lowest since September 2012 for Democrats. That’s before Trump was elected. If Biden wins, Democrats’ confidence will go up and Republicans’ confidence will fall. The betting market shows there is a 50.4% chance Trump wins the presential election and a 43.2% chance Biden wins. However, the polls show Biden has a solid lead. The average of recent polls shows Trump’s net job approval is -5.2% and Biden is ahead by 5.5%.
Conclusion
There’s no logic to saying stocks can’t be where they were x number of years ago because the economy is worse than then. This is probably the worst economy since the Great Depression. Stocks won’t go back to 1930s levels. The government reopening the economy is only the first step to getting back to normal. The leading economic indicators index and the ECRI leading index had their worst drops ever. The Bloomberg Consumer Comfort index had its worst 4 week decline ever by far.
Have comments? Join the conversation on Twitter.
Disclaimer: The content on this site is for general informational and entertainment purposes only and should not be construed as financial advice. You agree that any decision you make will be based upon an independent investigation by a certified professional. Please read full disclaimer and privacy policy before reading any of our content.


