UPFINA's Mission: The pursuit of truth in finance and economics to form an unbiased view of current events in order to understand human action, its causes and effects. Read about us and our mission here.
Reading Time: 4 minutes
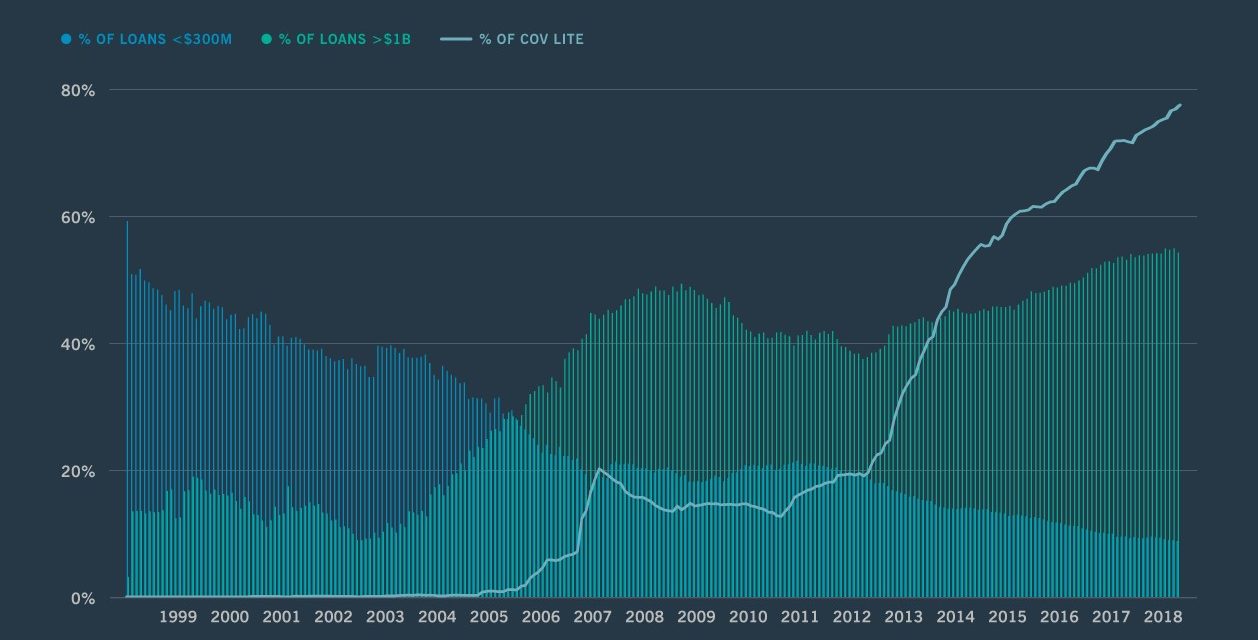
Cov-lite loans are loans with fewer covenants. That means they have fewer restrictions for borrowers. A lender might set a covenant based on leverage to ensure the borrower doesn’t fall into trouble. If the borrower violates a covenant, the lender can reprice the loan. As you can see from the light blue line in the chart below, cov-lite loans are about 80% of leveraged U.S. debt.
The situation is a bit more complex than saying these new loans are black boxes so it will definitely end badly in the next recession.
It takes high confidence to claim all these loans given out by lenders are a mistake. Obviously, lenders don’t see it that way. There is an argument to be made that they won’t be problematic. Cov-lite loans had lower default rates and higher recovery rates in the last recession. Specifically, in November 2009 the overall default rate on levered loans was 10.81% and the cov-lite default rate was 5.19%.
Cov-lite loans have also had high recovery rates. From 1987-2017, the average recovery rate was 71%. For first lien loans it was 73%, for 2nd lien loans it was 53%, and for senior unsecured loans it was 47%. In the last recession, default rates were lower because only the best borrowers received cov-lite loans. This cycle, cov-lite loans will look like the average since they dominate the market. Therefore, the question is if default rates will peak higher in the next recession. That partially depends on the depth of the next recession.
Cov-lite loans might perform worse in the next recession because, according to S&P Global, based on post-crisis defaults, cov-lite recoveries are down about 10 cents on the dollar compared to pre-crisis vintage. That’s interesting because the average spread between cov-lite loans and treasuries has been lower than that of full covenant loans. That implies cov-lite loans on average were considered less risky. The two spreads have been close since 2010 and are correlated. The market doesn’t see the fear spread by the bears.
Chicago Fed National Activity Index Improves
The best way to summarize the August Chicago Fed National Activity index is that the data improved, but the economy is still in a slowdown. That’s because the index improved from -0.41 to 0.1, but the 3 month moving average was negative for the 7th straight month. The 3 month average improved from -0.14 to -0.06. There was broad modest weakness. That’s a great summary of this slowdown as it’s not driven by one sector like the slowdown of 2015-2016 was driven by energy.
In the index, manufacturing was pulled to the positive side by the industrial production report and to the negative side by the ISM report. The employment, sales/orders/inventories, consumption and housing categories all had slight declines of 0.2. Nothing is an anchor, but most components were down. 51 of the 85 metrics in this report were included in the August reading. That explains why the index has such large revisions.
U.S. Manufacturing PMI> German PMI
The US flash September Markit PMI showed sequential improvement, but had a lot of underlying weakness. The best light to put this report in is that the U.S. manufacturing PMI vastly outperformed that of Europe and Germany as you can see in the chart below.
The composite PMI increased from 50.7 to 51 which is a 2 month high. The services PMI was up 0.2 to 50.9 which is also a 2 month.
The manufacturing PMI and the manufacturing output index both hit 5 month highs as they increased 0.7 and 0.9 to 51 and 51.7. It’s weird to see manufacturing outperforming services as many economists see this slowdown as being led by the manufacturing sector because it’s being hurt by global growth, the trade war, and the strong dollar. Even with those headwinds, the US manufacturing PMI way outperformed the German manufacturing PMI which fell from 45.3 to 41.4 which is a 123 month low. The Eurozone manufacturing PMI fell from 47 to 45.6 which is an 83 month low.
Germany Is Exposed
As you can see from the chart below, German stocks are highly impacted by global growth.
The beta of German equity returns to world trade growth is 3.1 which is much more than the S&P 500 which is at 2.3. This makes sense because the export driven German economy is impacted by trade as the September Markit PMI suggests. Even the German services sector saw a sequential decline as it fell from 54.8 to 52.5 which is a 9 month low.
Details Of U.S. PMI Report
The details of the US flash Markit report weren’t pretty as the composite PMI is consistent with just 1.5% GDP growth which is below the consensus of 2%. Furthermore, the sector payroll numbers dropped for the first time since January 2010 which is why Markit sees less than 100,000 monthly payrolls growth in September. Overall private sector new business growth was the weakest since at least October 2009. That’s the same for the service sector. Service sector input costs fell the most since late 2009. The manufacturing sector was helped by stronger output and new order growth. There was also a slight increase in employment. On the other hand, purchasing activity and pre-production inventories fell. Finished goods were depleted. International new work fell for the 4th time in 5 months.
Global Monetary Stimulus
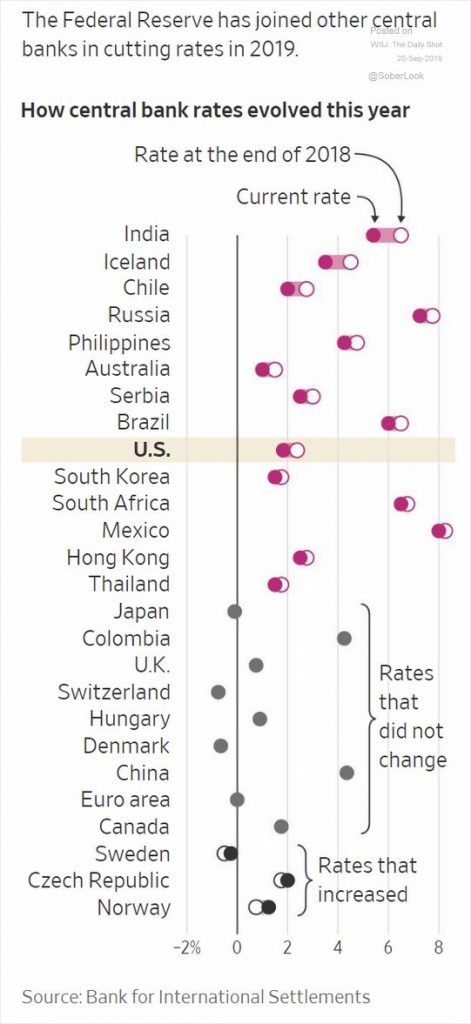
The chart below shows the 14 central banks which have cut rates this year.
This might provide a monetary stimulus. India should drive global growth in 2020 because it is adding in a fiscal stimulus through tax cuts. India is cutting its corporate tax rate to 25.2% from 30%. It’s local companies will pay a rate of 22% and new manufacturing firms will pay 17.01%.
Conclusion
Cov-lite loans might not be a problem. They had lower default rates and high recovery rates in the last recession. They also trade at a similar spread to full covenant loans. The Chicago Fed index and the Markit PMI signal improvements, but a continuation of the slowdown. India is cutting rates and cutting taxes. That stimulus should allow India to drive global growth. It’s growth rate might increase its gap with China which has been deleveraging and seeing slower growth.
Have comments? Join the conversation on Twitter.
Disclaimer: The content on this site is for general informational and entertainment purposes only and should not be construed as financial advice. You agree that any decision you make will be based upon an independent investigation by a certified professional. Please read full disclaimer and privacy policy before reading any of our content.


