UPFINA's Mission: The pursuit of truth in finance and economics to form an unbiased view of current events in order to understand human action, its causes and effects. Read about us and our mission here.
Reading Time: 5 minutes
There are two separate points on the yield curve you must grasp. Firstly, the long yield fell below the short yield instead of the short yield rising above the long yield like usually happens. This big decline in long rates helped the housing market. That might mean this yield curve inversion won’t lead to a recession. However, given the yield curve’s track record in predicting US recessions, it’s not the best idea to completely ignore it. If you’re a bull who doesn’t think the inversion is a big issue, you’d still rather the inversion not precede a steepening just to be on the safe side. That’s because it’s the steepening after the inversion that coincides with recessions, not the inversion itself. Usually, the curve steepens very quickly during recessions as the Fed cuts rates. We aren’t talking about a few basis points. We’re talking about a couple percentage points of steepening.
A Pivotal Point For The Yield Curve
As you can see from the chart below, it appears we are at crossroads as to whether this yield curve inversion will be like the ones which indicated a recession or the ones that didn’t.
The curve is currently flatter than the average for both examples. At about the 3 month mark after the first rate cut, the inversions that preceded recessions saw the curve steepen significantly. If the curve stays flat over the next couple months, it increases the odds that there won’t be a recession soon. As we mentioned earlier, this analysis might not even matter. The 10 year yield has been correlated with nominal growth. A low yield means lower growth is coming. If the yield spikes, it would steepen the curve, but also imply nominal growth will improve.
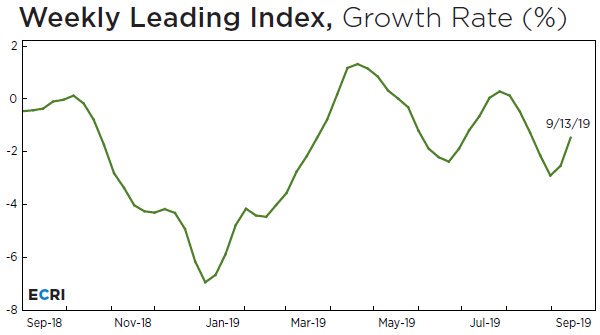
ECRI Leading Index’s Growth Rate Improves
Just like the leading indicators index, the coincident ECRI index is growing quicker than the leading index. The notable difference here is the ECRI leading index includes data from September. It was also below the coincident index in August. The good news is the growth rates are headed in opposite directions. The ECRI coincident index’s growth rate fell from 2% to 1.8%. It’s very interesting to see this compared to the last slowdown where growth bottomed at about 1% in 1H 2016. This slowdown hasn’t gotten as bad as the last one, but it’s closing in.
As you can see from the chart below, the leading index’s growth rate spiked from -2.5% to -1.5% in the week of September 13th.
In Q4, the comparisons will get easier. It will be important to review the sequential change in the index to see if economic growth is really accelerating. The index increased from 144.8 to 146.7 in this past week.
Q3 GDP Growth Estimates
The CNBC median estimate for Q3 GDP growth is 2%, but that might be too conservative because it only increased 0.1% after the industrial production and housing starts report. They were big beats and probably should have improved estimates more. The NY Fed’s Nowcast agrees as it increased from 1.59% to 2.24% which is its highest estimate for this quarter. It’s better to have high estimates later in the quarter like now because they include more data.
The housing starts and industrial production reports increased the growth estimate by 0.3% and 0.31% respectively. The estimate for Q4 GDP growth increased from 1.11% to 1.96%. Suddenly, this slowdown doesn’t look close to recessionary. You don’t see cycle high housing starts and permits in recessions. The usually bullish St. Louis Fed Nowcast is once again very bullish as it sees Q3 GDP growth of 3.02%.
China Trade Negotiations Incoming (Maybe)
In early October, China and the US will have trade meetings. Both sides have plenty of reason to make a deal as China faces slowing growth and food shortages and Trump faces an election in November 2020. The recent negative news was that Trump isn’t looking for a partial deal and that Chinese representatives decides not visit Montana, cutting their stay in the US short.
Goldman Sachs has calculated a trade war barometer using markets to suggest there is a 40% chance of a trade deal. The reality is anything is possible in the near term. The barometer showed there was about an 80% chance of a deal this spring. The market was wrong to be so hopeful. It’s good to see the market less hopeful now as there is less room for it to be disappointed.
The chart below shows the tariffs as a percentage of the US economy.
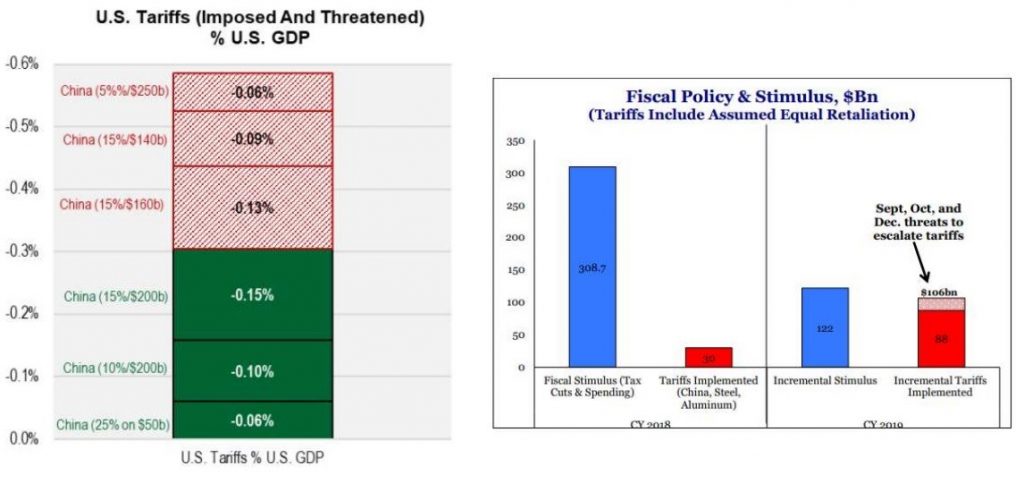
The tariffs almost completely counteract the fiscal stimulus in 2019. There hasn’t been a large impact on consumption growth yet, but that’s because retailers don’t rush to raise prices after tariffs go into effect. The longer the tariffs are in effect, the greater the impact.
University Of Michigan Index Isn’t Signaling A Recession Yet
The University of Michigan consumer confidence index is in the penalty box because it fell in August, even though retail sales were strong. However, it’s still notable that even it didn’t fall enough to signal a recession. As you can see from the chart below, the minimum decline in the current index preceding a recession out of the past 5 cycles was last cycle when it fell 19.8 points. The chart shows it has fallen 15.9 points.
This chart doesn’t show the latest reading where the index increased to 106.3. That puts it farther away from a recession call.
Weak Manufacturing Expectations
Just like the Empire Fed index, the September Philly Fed manufacturing index fell slightly and the 6 month expectations index cratered sharply. The current index fell from 16.8 to 12. As the chart below shows, the average of the Philly and Empire Fed indexes has been higher than the ISM PMI.
The Philly Fed new orders index fell 1 point to 24.8 and the shipments index rose 7.4 points to 26.4. The average employee workweek index rose from 6.8 to 13. In August, the leading indicators index was helped by manufacturing hours worked. Maybe it will be helped by that again. The 6 month expectations index crashed 11.8 points to 20.8. New orders fell from 44.1 to 35.2. Unlike the Empire Fed report, the capex index rose from 22.6 to 25.9.
Conclusion
The yield curve is at a crossroads. If it steepens soon, then it could be signaling a recession. If it doesn’t steepen in the next couple months, there might not be a recession. The ECRI leading index doesn’t signal much because its growth rate has been hovering around the flatline for a few months. The great economic data this past week signals Q3 GDP growth is more likely to be above 2%. Trade negotiations will heat up in the next few weeks. Even the bearish University of Michigan consumer confidence survey isn’t giving off a recession signal. The September regional Fed manufacturing reports have signaled modest growth, but the 6 month expectations indexes have cratered.
Have comments? Join the conversation on Twitter.
Disclaimer: The content on this site is for general informational and entertainment purposes only and should not be construed as financial advice. You agree that any decision you make will be based upon an independent investigation by a certified professional. Please read full disclaimer and privacy policy before reading any of our content.


