UPFINA's Mission: The pursuit of truth in finance and economics to form an unbiased view of current events in order to understand human action, its causes and effects. Read about us and our mission here.
Reading Time: 5 minutes
Even though headline job growth missed estimates and the revisions were negative, it still was a solid report because the misses were small. As we will delve into later in this article, the real weakness was in wage growth. Job creation in October was revised down 4,000 to 152,000. Job growth in November was revised down 10,000 to 256,000. That report was driven by the end of the GM strike. November manufacturing job creation was revised up 4,000 to 58,000 which wouldn’t be possible without that one time event. In December, there were 145,000 jobs added which missed estimates by 13,000. A 14,000 negative revision and a 13,000 miss are very small changes not worth worrying about. 1 year average job creation was 176,000. The 3 month average was 184,000 as it was lifted by November’s reading.
The key to contextualizing job creation is to compare it to population growth and labor force growth. The labor market is getting tighter if it’s higher than both. As you can see from the chart above, there needs to be 104,000 jobs added per month to keep up with population growth and 157,000 to keep up with labor force growth. The labor force has been growing faster because people are coming off the sidelines. The current 3 month and 12 month averages show the labor market is tightening, although, average job creation is falling (tightening at a lower rate).
Where The Jobs Were
The breakdown of job creation by industry was vastly different from the ADP report. The biggest difference was in professional and business services which was said to have created 61,000 jobs in the ADP report, but it only created 10,000 as the table below shows. This was the weakest job creation since January 2019. This decline and the burst in hiring from retail trade which increased from -14,000 to 41,000 (highest since January 2017) negatively impacted wage growth because professional and business is one of the better paying industries and retail trade is the 2nd worst.
The good news in this report is the decline in education and healthcare job creation from 72,000 to 36,000 can be reversed because it’s not a cyclical industry. The ADP report stated trade, transportation, and utilities job creation was 78,000 which was the 2nd best since 2002. In reality, it added 40,000 jobs which is solid, but not ground breaking. Finally, leisure & hospitality and information created 40,000 and 3,000 jobs which was way above the ADP’s reading of losses of 21,000 and 14,000 jobs.
Markit Does Better Than ISM
The manufacturing sector lost 12,000 jobs which missed estimates for a decline of 1,000. That weakness isn’t a surprise because the Markit, ISM, and regional Fed readings all fell in December. We’re still waiting for the industrial production report to confirm the weakness in December. One of the hottest topics is whether the Markit or ISM manufacturing report is more accurate. We favor the Markit report because it has a greater sample size and surveys medium and small firms unlike the ISM report which has a small sample size and only reviews large firms. As you can see from the chart below, this inkling is correct as the Markit employment index has a 91% correlation with the manufacturing payroll change. The ISM employment index has a much lower 78% correlation.
Driver Of Cyclical Weakness
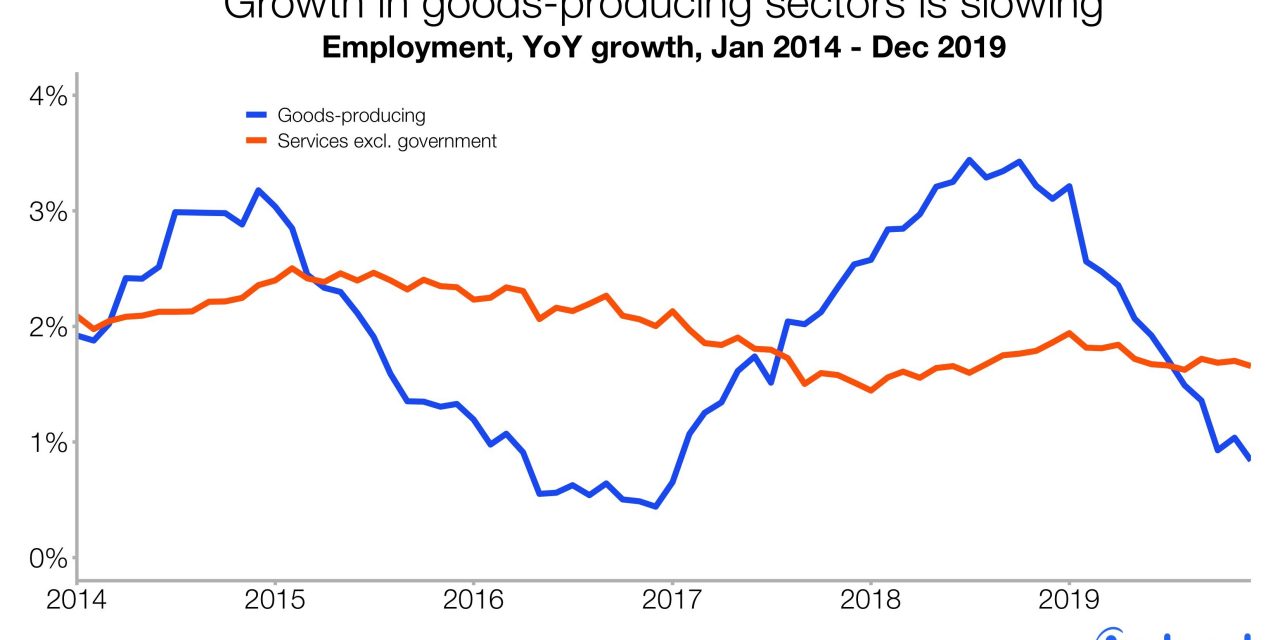
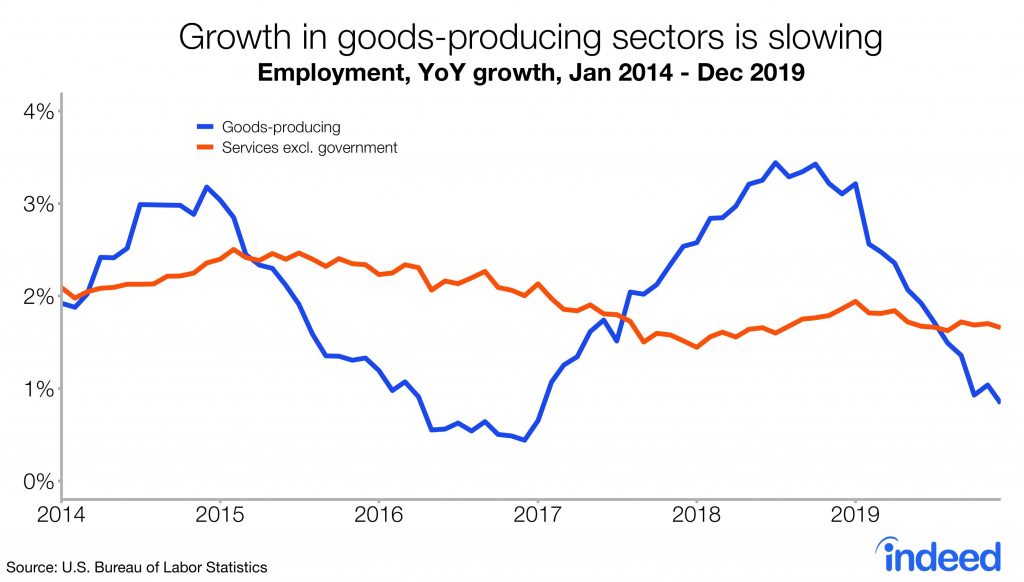
There has been a decline in job creation growth. Is it occurring because the labor market is tight or because economic growth is slowing? It’s the former if you focus on the service sector and the latter if you focus on the goods producing sector. Service sector job creation had been falling because the labor market was tightening, prior to the tax cuts in 2018. The tax cuts temporarily boosted service sector job growth which returned to lower levels in 2019. The chart below shows the cyclicality of the goods producing sector. Its job growth fell in 2019 just like from 2015-2016. If growth bottoms where it did last slowdown, there’s not much more room for it to fall. Let’s see if manufacturing production improves in 2020.
Major Decline In Wage Growth
The headline of the December labor report is the decline in wage growth. For average hourly wage growth, this is the continuation of an existing trend, while for non-supervisory and production wage growth, it was a wake-up call as its lead over overall wage growth fell. Low wage industries still had high wage growth. It will be interesting to see how the minimum wage hikes at the start of the year impact wages in the January report.
As you can see from the chart below, private sector hourly wage growth fell from 3.14% to 2.87% which missed estimates for 3.1%. if you don’t round the numbers to tens place, you can see the decline was about 27 basis points not 0.2%. The plus side is the comp was the 2nd highest of the cycle. Still, this decline in wage growth has been going since February as the total decline is 53 basis points. The decline in non-supervisory and production wage growth was 36 basis points to 3.03%. That’s a 59 basis point decline from the peak 2 months ago.
The decline in wage growth is bad for consumers, but good for businesses as wage inflation will be lower. Margins were a big problem in 2019 especially for smaller firms and those in the service sector. Weekly wage growth faced added trouble in December because of weakness in hourly pay and the length of the work week. There were 34.3 hours worked per week which missed estimates by 0.1. The November work week length was revised 0.1 lower to the same length as December. In December, weekly wage growth fell from 2.84% to 2.27% which was the lowest rate since March 2017. As you can see from the chart below, aggregate weekly hours growth is at a cycle low. This data combines the length of the work week and job creation.
Lowest Underemployment Rate Ever
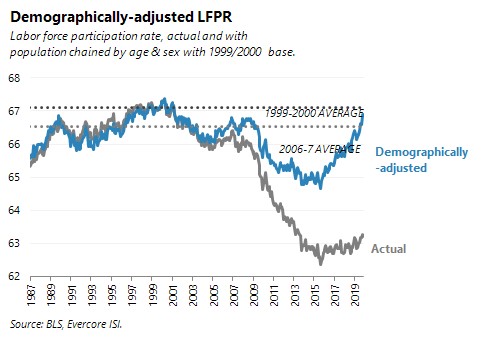
The unemployment rate stayed at 3.5%. The underemployment rate fell 0.2% to 6.7% which was the lowest reading ever going back to 1994. The previous record low was 6.8% in October 2000. The overall labor force participation rate stayed at 63.2%. The prime age labor force participation rate rose 0.1% to 82.9% which is the highest rate since June 2009 which was the last month of the recession. As you can see from the chart below, the demographically adjusted labor force participation rate is now 0.2% from the average from 1999-2000.
Conclusion
The December labor report showed another month of job creation. Wage growth was weak though as the sharp decline in non-supervisory and production wage growth in the past two months is troubling. The decline in wage growth is bad for consumers, but good for firms with high labor costs.
Have comments? Join the conversation on Twitter.
Disclaimer: The content on this site is for general informational and entertainment purposes only and should not be construed as financial advice. You agree that any decision you make will be based upon an independent investigation by a certified professional. Please read full disclaimer and privacy policy before reading any of our content.


