UPFINA's Mission: The pursuit of truth in finance and economics to form an unbiased view of current events in order to understand human action, its causes and effects. Read about us and our mission here.
Reading Time: 5 minutes
This article will review household balance sheets and the housing market, but we’ll quickly start with reviewing the updated data on earnings and leading indicators to show you the economic growth slowdown in real time. The table below from The Earnings Scout shows a continuation of the recent trend of weakening earnings estimates.
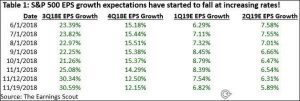
Source: The Earnings Scout
The estimates for Q4 continued to drop as they fell from 14.29% to 12.15% since the start of the month which makes Q4 by far the lowest growth quarter of the year. This is similar to GDP growth estimates as the median growth estimate in the CNBC rapid update has Q4 increasing 2.8% which is below Q3’s rate of 3.5%. Q1 earnings estimates dropped quicker than Q4’s earning estimates in the past week as they fell from 7.54% to 6.82%. Q2 earnings estimates dropped to only 5.89% growth. The pattern is clear; analysts are expecting earnings growth to deteriorate. If the trend continues, there could be an earnings recession in 2019.
ECRI has been predicting a growth slowdown for over a year. This is finally bearing fruit as Q3 slowed as compared to Q2’s growth rate and Q4 is on pace to be slower than Q3 as we mentioned earlier. The chart below shows their leading indicator is now down 3% year over year.
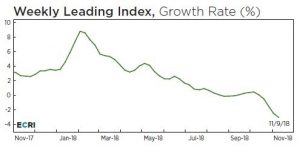
Source: ECRI
Growth has been declining in the past few weeks as comparisons have gotten tougher. The co-founder of ECRI, Lakshman Achuthan, stated that there isn’t a magic level that the index hits which signals a recession will occur. Growth is at a 140 week low. We’ll be looking at how this decline stacks up against other slowdowns this cycle if the index progresses lower.
3 Reports On Households & The Housing Market
This article will include data from three pivotal reports which were just released. The three are the October Senior Loan Officer Opinion Survey on Bank Lending Practices which is released by the Fed, the fiscal 2018 Department of Housing and Urban Development’s annual report to Congress regarding the financial status of the FHA mutual mortgage insurance fund, and the NY Fed’s Q3 Household Debt and Credit report.
Are FHA Loans A Problem?
The only shocking data in these reports is from the HUD annual report. We’ve included the other recently updated data to tell the whole story on housing. We don’t use the word shocking lightly. The FHA is giving out mortgages to borrowers who may not be able to pay them back if the economy declines. In the last housing bubble, banks gave mortgages to borrowers who couldn’t afford them and now the FHA is doing the same thing. The situation got worse in 2018.
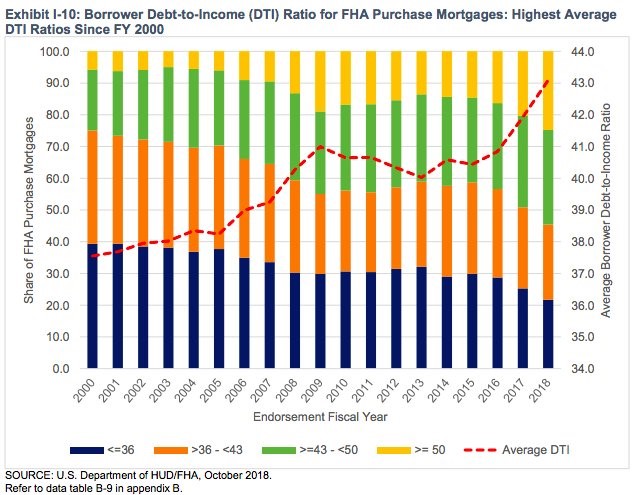
The chart below shows the debt to income ratio of borrowers.
Private banks prefer borrower’s debt to income ratio to be 36% with no more than 28% of the debt going to pay the monthly mortgage bill. FHA loans are meant to allow more people to afford their first home who otherwise couldn’t because they have bad credit, low savings for a down payment, or low income.
The minimum credit score for a conventional loan is 620, while the minimum credit score for an FHA loan is 500. For an FHA loan you must put 10% down if your score is between 500 and 579. You can put 3.5% down if your score is 580 or higher. Monthly housing related debt payments such as mortgage and property tax payments as a percentage of gross income shouldn’t go above 31%, but 40% is allowed. Including monthly payments like auto loans and credit card payments, the ratio shouldn’t go above 43%, but it can go up to 50%.
The concept of giving loans to people who can’t afford them is problematic because ultimately math is still math. If you spend too much money on your mortgage, you won’t be able to function especially if you lose your job or an unexpected expense comes up. It’s a terrible situation to be in.
The red line in the chart shows the average debt to income ratio of FHA mortgages. It has been climbing steadily since 2015. It is about 2% higher than the peak in 2009 as it is now 43.09% (record high). It seems like all the home buyers who really shouldn’t be getting a mortgage have moved on from unscrupulous lenders to the government. The really scary part is about 25% of borrowers have a debt to income ratio of 50% or higher which is a record high since 2000. Many of these loans might go sour in the next recession. In 2007, which was the height of the housing bubble, only about 10% of borrowers had a debt to income ratio of 50% or higher. The good news is over 20% of borrowers had a credit score less than 579 in 2007 and now close to 1% have those low scores.
Demand For Mortgages Is Falling
Rising rates are causing demand for commercial and industrial loans and mortgages to fall. Even the easy lending standards the FHA has can’t entice borrowers to demand mortgages. The Fed chart below shows the net percentage of lenders saying there is stronger demand for mortgages.
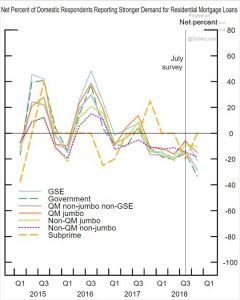
Source: Federal Reserve Bank
Demand for all mortgage types is declining except for subprime loans (ground zero of the housing bust). In the previous 3 years, the peak of the year showed stronger demand, but it has been negative all 2018.
NY Fed Shows Us This Isn’t 2007
Private mortgages from banks look pristine as you can see from the NY Fed chart below.
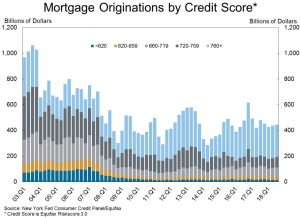
Source: NY Fed
The median credit score for borrowers in Q3 2018 was 758 which is very high. The most popular credit score range for FHA loans is from 620-679. The most prevalent range for private mortgages is 760+. There aren’t zero document teaser rate mortgages which were loans where you didn’t need to provide proof of income and had a low introductory interest rate which increased after a certain period. Those helped fuel the last bubble and its burst.
Student Loan Delinquencies Soar
The NY Fed report showed total household debt hit a record high of $13.51 trillion. Housing debt is $9.56 trillion which is still below last cycle’s peak of $9.99 trillion. This report wasn’t perfect as the chart below shows.
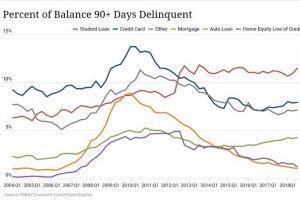
Source: NY Fed
The biggest negative was the student loan delinquency rate increased from 10.9% to 11.5%. The cycle peak was 11.8%. It’s pretty bad to have such a high rate after a 9 year expansion. Auto loan delinquencies increased from 4.2% to 4.3% and credit card loans stayed at 7.9%. Finally, mortgage delinquencies stayed low at 1.1%.
Conclusion
Economic growth is slowing according to GDP estimates, earnings estimates, and the ECRI leading index. The housing market is beginning to show weakness as demand for loans is falling. The good news is the delinquency rate on mortgages is low and private borrowers have a high credit score. The bad news is FHA loans are increasingly being given to people with debt to income ratios of 50% or higher.
Have comments? Join the conversation on Twitter.
Disclaimer: The content on this site is for general informational and entertainment purposes only and should not be construed as financial advice. You agree that any decision you make will be based upon an independent investigation by a certified professional. Please read full disclaimer and privacy policy before reading any of our content.


