UPFINA's Mission: The pursuit of truth in finance and economics to form an unbiased view of current events in order to understand human action, its causes and effects. Read about us and our mission here.
Reading Time: 5 minutes
There is never a clear answer as to where the economy is in the business cycle. That’s what makes it so interesting to discuss and profitable to make money on if your timing is correct. Not everyone is a speculator in stocks who will take high leveraged bets on the direction of the economy, but everyone should be aware of the direction it’s headed in. One quick practical example of where this could benefit readers is the used car market. Used car prices are falling because of the increase in supply from the high number of leases expiring. Therefore, if you delay your purchases of a used car by a few months, you’ll probably get a cheaper price on it. By paying attention to the economy, you can learn these nuggets of information which can save you money.
One of the best economic indicators is commercial and industrial lending. Credit to businesses is the lifeblood of the economy. Without credit, firms can’t expand or in the case of this cycle, buy extraordinary amounts of their own stock pushing market valuations higher. As you can see from the chart below, the C&I lending peaked in November. Just because there hasn’t been a recession, doesn’t mean it’s worthless. If it starts falling quickly instead of stalling, it will become a more powerful indicator. The chart shows the commercial real estate market is also stalling. In the last two cycles their timing wasn’t in sync like it is now. If they both fall in concert, this is a powerful recession indicator.
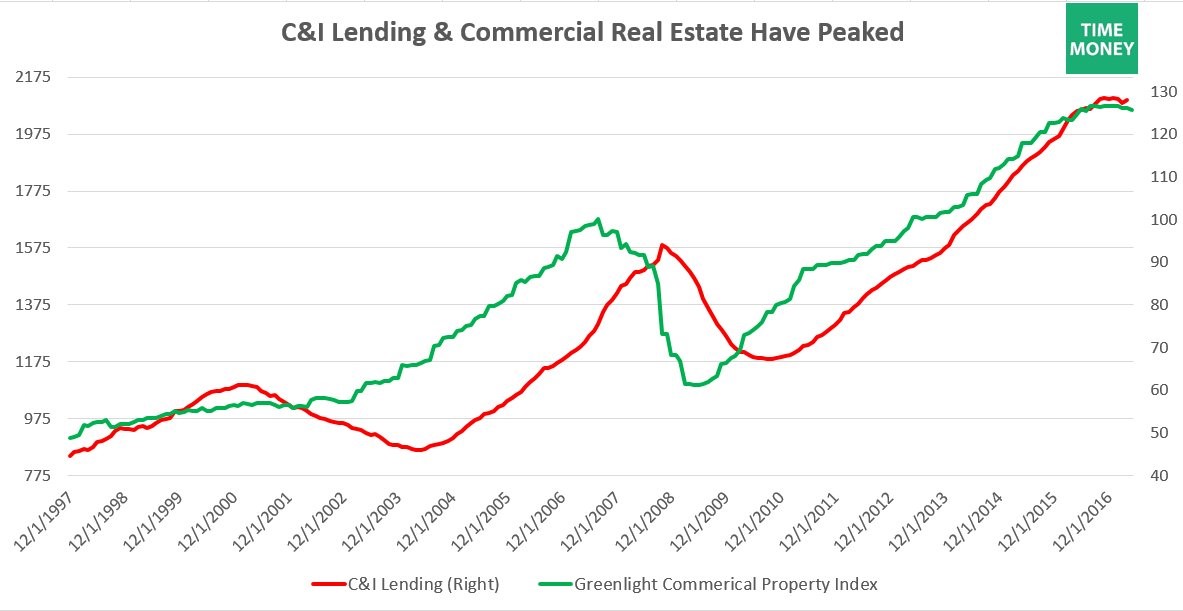
C&I lending and commercial real estate have peaked together
The best performing category in commercial real estate is public storage. You may have noticed these businesses exploding in popularity. As baby boomers retire, they are utilizing these warehouses to store their possessions. It’s certainly a throwback to see these firms doing well because millennials are less interested in material possessions, as they prefer spending money on experiences. In the next recession, this leader may be a laggard as these stocks have soared. Public storage stock has fallen 25% after rallying several hundred percent. When the leaders start to dwindle, it’s a signal the cycle is ending.
Looking at credit on a grander scale, the chart below shows the 2nd derivative of global credit growth.

Global credit growth is crashing
The second derivative measures the rate of change of growth. At times, it can be a leading indicator to cyclical changes. It can also have some false positives as it picks out the changes in an amplified manner. As you can see, there was a false positive in 2014 as the rate of change went negative, but there wasn’t a recession. As of April 2017, the rate of change went below the 2014 low, signaling the warning sign is getting louder. The economy has always been reliant on credit, but the numbers have gotten bigger because of demographic woes in developed economies. Even China’s economy, which is part of the developing world is reliant on stimulus. As you can see from the light green bars, China’s unwind has been the catalyst of the decline in credit impulses.
A great way to get a summary of the economy is to look at indexes which group together a few indicators. The chart below shows the weekly leading index’s growth rate in the past 27 years.
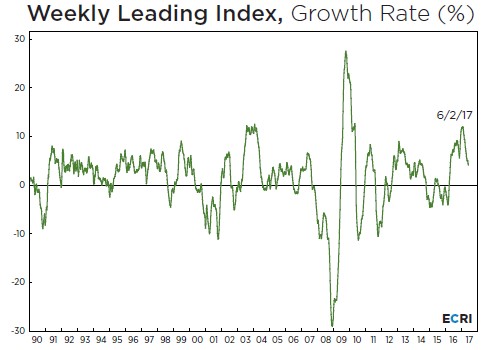
The growth rate of the leading index is slowing, but is still positive
The decline in the lifeblood of the economy, which is credit, finally caught up to this index causing it to fall in the spring after rising since the election. One key component of this indicator is the ratio of large business failures to new businesses being created. The more new businesses being created and the fewer the large businesses failing, the better. This index was created by the ECRI Institute which predicted the past two recessions, but had a false positive by predicting a recession in 2011/2012. As you can see from the chart, the index was just as negative in 2011 as it was during the recession in the early 2000s. The current reading doesn’t signal a recession, but it’s headed in the wrong direction.
Besides stock buybacks, corporations who are issuing record amounts of debt versus GDP have been pouring the money into mergers and acquisitions. As you can see in the chart below, the global size of M&A activity has been falling from the peak in late-2015.
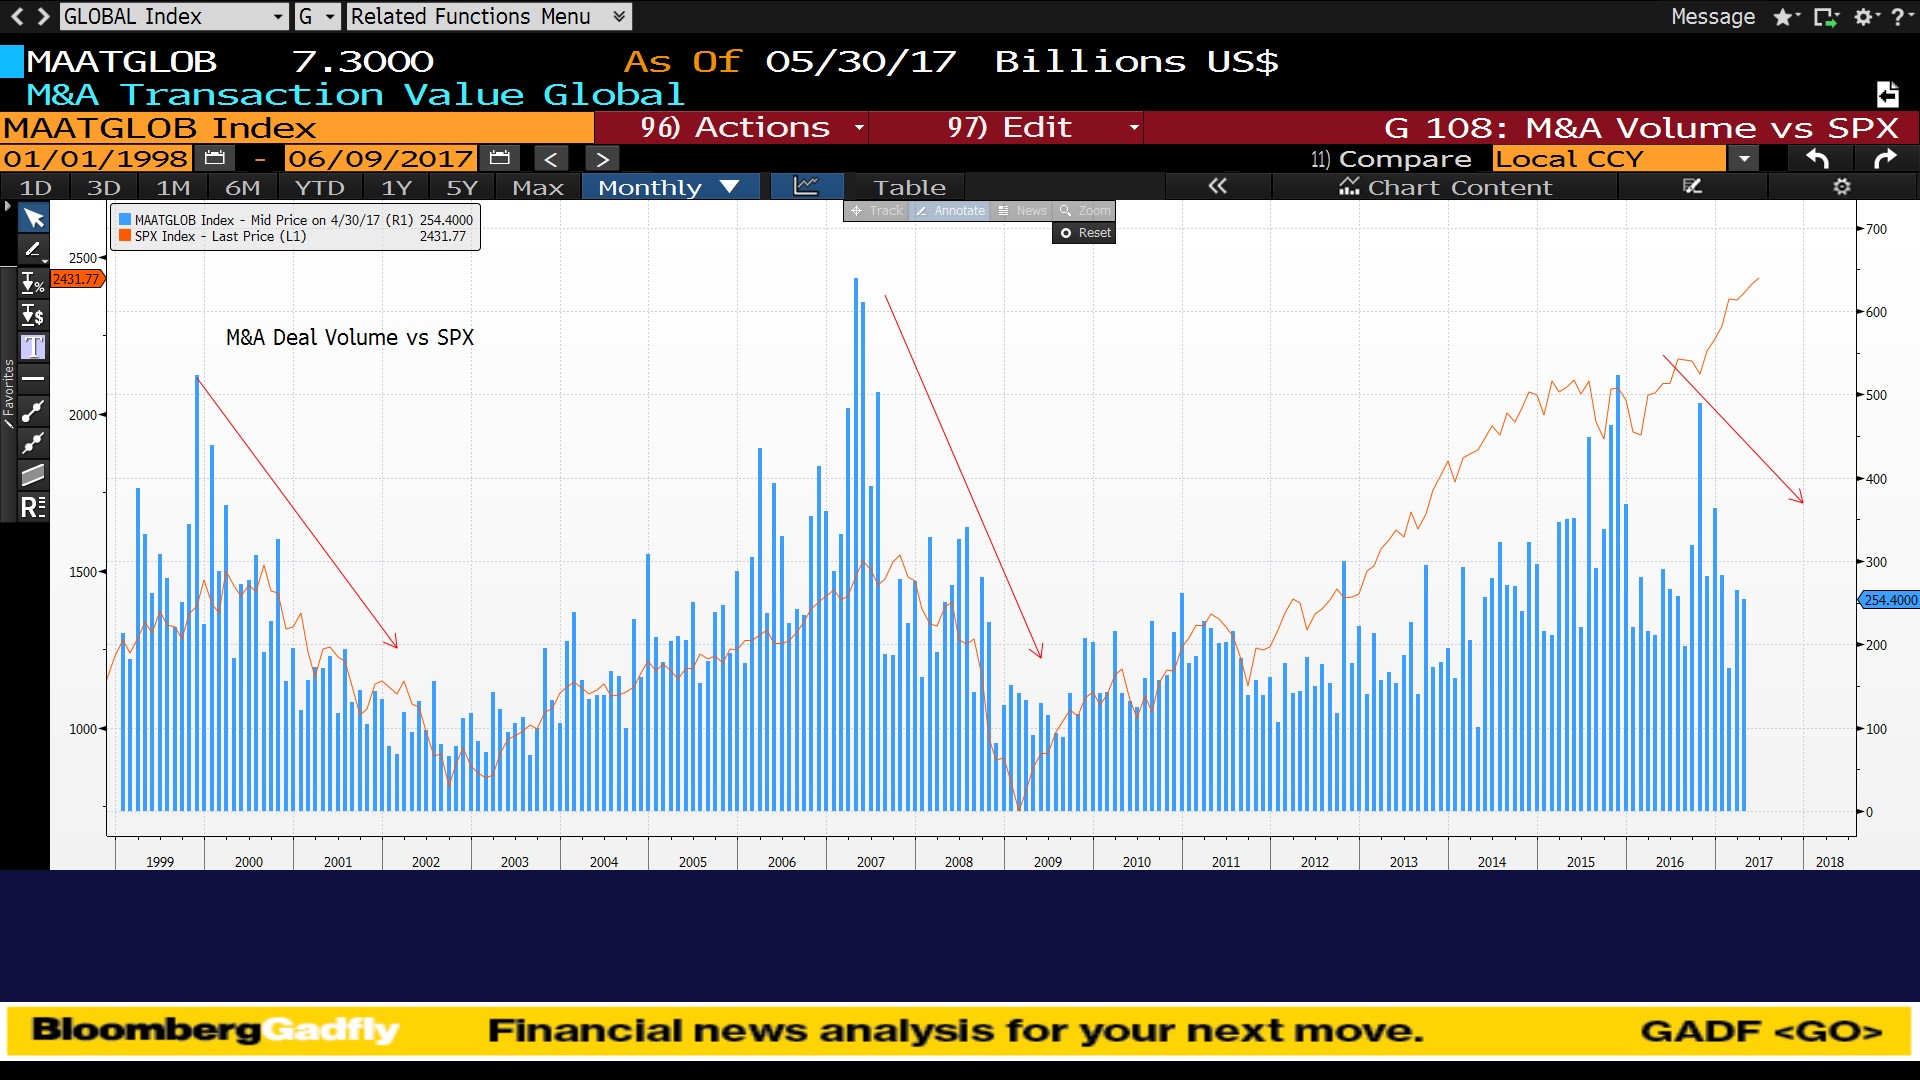
Global m&a volume has been declining since late-2015
In the past, the peak in M&A activity has occurred before the peak in the stock market. On the other hand, the recent decline may have been catalyzed by the decline in S&P 500 profits in 2015 and 2016. Now that the corporate profit recession has ended in 2017, there may be a burst in M&A activity which could reverse this indicator.
The chart above is slightly unclear because of the seasonality of M&A activity and because there’s a lot of data there. The chart below simplifies the chart above and only shows Q1 reports which corrects the seasonality problem. As you can see, M&A activity has increased every year since the 2008 recession except in Q1 2012 and Q1 2017. A second decline in Q1 2018 would be another strong recession indicator.
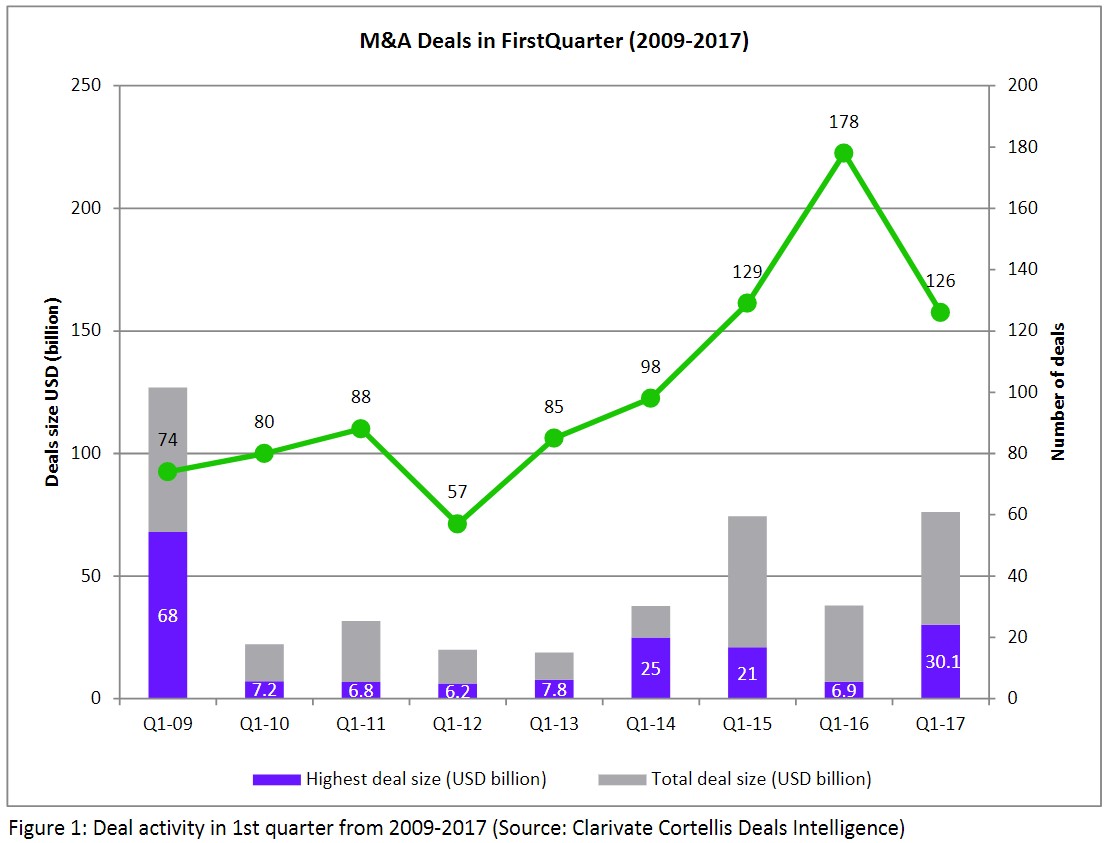
M&A deals in Q1 2017 fell year over year for the first time since Q1 2012
The ultimate recession indicator is the yield curve. You can think of the yield curve as an hour glass. When the Fed raises rates, it accelerates the sand falling from the top. The top runs out of sand when the yield curve goes negative. As you can see from the chart below, the difference between the 10-year bond yield and the 2-year bond yield is 85 basis points which is a few points higher than it was in 2016 which was the lowest spread of the cycle. Out of the hour, the yield curve is signaling there’s about 10 minutes before the next recession.

The yield curve is flattening
Conclusion
Credit weakness and M&A activity are signals the economy may fall into a recession. The leading index is still positive which means nothing is imminent. The bond market is waving a yellow flag as the yield curve is flattening. This means the Fed is near the end of its hike cycle.
The takeaway from this article is to avoid high risk gambles like shorting the VIX which is the stock market volatility index, avoid making big investments in a friend’s small business which is economically sensitive, and take your money out of stocks if you need the money to buy something like a house or a car in the next 5 years.
Have comments? Join the conversation on Twitter.
Disclaimer: The content on this site is for general informational and entertainment purposes only and should not be construed as financial advice. You agree that any decision you make will be based upon an independent investigation by a certified professional. Please read full disclaimer and privacy policy before reading any of our content.


