UPFINA's Mission: The pursuit of truth in finance and economics to form an unbiased view of current events in order to understand human action, its causes and effects. Read about us and our mission here.
Reading Time: 4 minutes
The S&P 500 hasn’t had a 1% or more move in 72 straight trading sessions (as of Friday). That’s the longest streak since October 2018. The longest streak in 24 years is 94 days ending in January 2018. Furthermore, it has been 30 days since the S&P 500 has fallen on back to back days which is tied for longest streak since 2005. Therefore, it is no surprise that the stock market’s performance in December was a key driver of the Leading Indicators index. Without stocks doing well, it would have had below 0% yearly growth for the first time of this cycle. Instead it had just 0.1% growth. Even still, its monthly growth rate fell from 0.1% to -0.3% which missed estimates by a tenth.
As you can see from the chart below, the leading index’s yearly growth rate would have been almost 1% lower without stocks. That’s the biggest positive impact the stock market had since the beginning of this expansion.
Stocks lapped the bottom of the Q4 2018 correction/mini bear market. Yearly comps for the S&P 500 will get tougher as the year goes on. Luckily, the comps for the leading index overall will get easier.
The interest rate spread was the only other indicator in this index that was improving. The length of the average work week, unemployment claims, new orders for consumer goods and materials, and the ISM manufacturing new orders index were all in worsening trends. The good news is initial jobless claims showed a worsening trend only because of a seasonal spike related to the end of the late Thanksgiving.
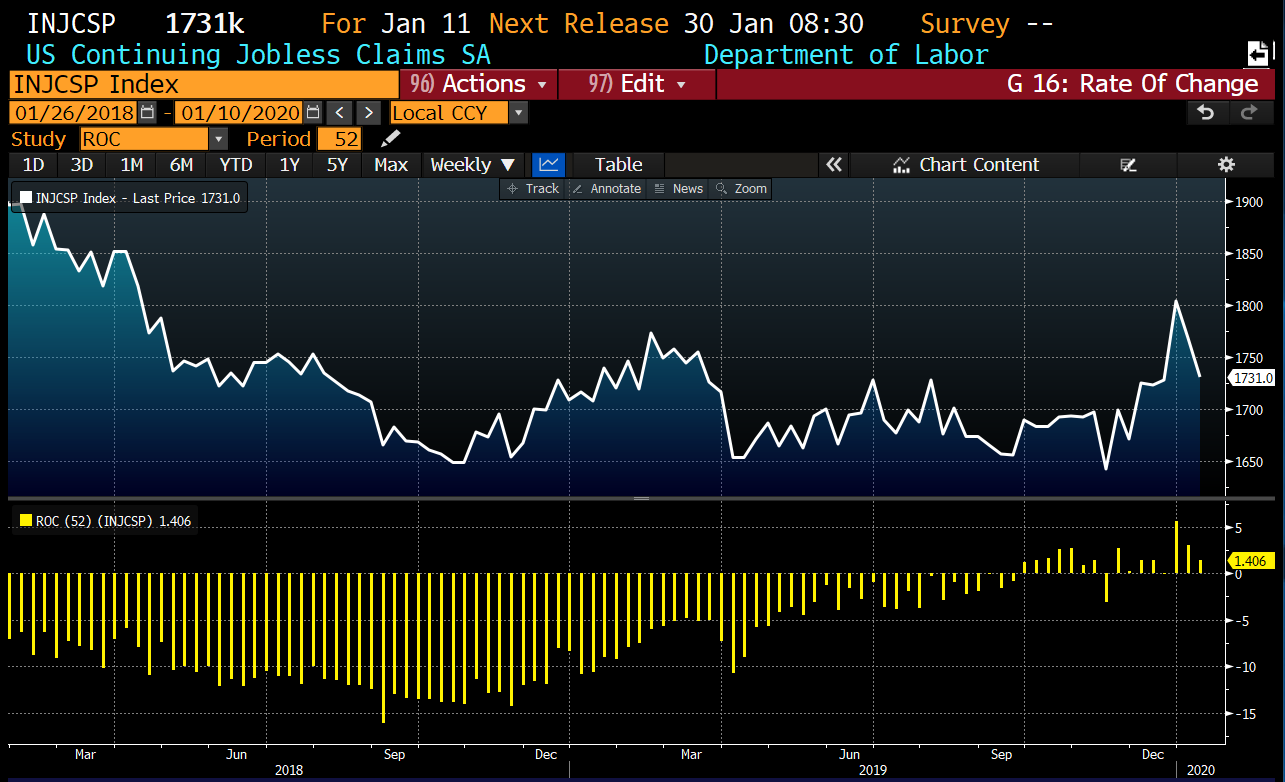
Initial claims have fallen sharply since then as the monthly average in December was 233,500, while the current January monthly average is only 210,000. In the week of January 18th, the number of claims rose 6,000 to 211,000 and the 4 week average fell 3,250 to 213,250. The spike in initial claims is old news though. The more recent controversy was the spike in continuing claims around New Year’s Day seen in the chart below. That was likely seasonal just like the post-Thanksgiving spike as continuing claims have fall from 1.804 million to 1.731 million in the past 2 weeks. Yearly growth fell from 5.6% to 1.4%.
Stocks Lead Leading Indicators
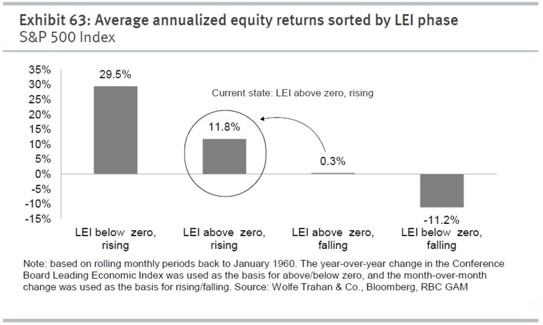
The December leading indicators index signals there will be weak stock returns. The chart below shows when the index is above 0 (meaning above 0% yearly growth) and falling (meaning negative monthly growth) average annualized gains are only 0.3%. If the yearly growth rate falls down a tick, there will be -11.2% returns and if the monthly growth rate is positive, gains will be 11.8%. We already know stocks and initial jobless claims will have a positive impact on the January reading and that the yearly comp will be easier. We expect positive yearly growth again.
The Leading Indicators report seems to be correlated with the ECRI’s coincident index. In December, the ECRI index stayed at 187.4 which lowered its yearly growth rate from 1.8% to 1.5%. That’s the weakest growth since September 2016. The growth rate troughed in the last mini-cycle in May 2016 at 0.9%. Let’s see if this slowdown has a lower trough. The leading ECRI index doesn’t suggest more weakness is coming in 2H 2020 as its growth rate in the week of January 17th increased from 4.3% to 5.2% (index stayed at 150.6).
Q4 Earnings Update
With 75 S&P 500 firms having reported results this earnings season, 69% have beaten EPS estimates with 4.23% growth and 66% have beaten sales estimates with 2.99% growth according to The Earnings Scout. Keep in mind, The Earnings Scout restates year ago numbers when it feels it is just. Not all firms do this. Specifically, year ago numbers can be changed when there are actions such as discontinued operations. The firm feels this makes comps ‘apples to apples.’
As you can see from the table below, blended Q4 EPS growth (actual & estimates) shows growth of 1.16%. This growth rate will get closer to the current 75 firm average in the coming weeks.
It’s a good sign that since the start of the year, Q1 expected EPS growth is the same, Q2 expected growth is up 37 basis points and Q3 expected growth is down just 2 basis points. Remember, Credit Suisse sees 6.2% 2020 EPS growth.
Oil Prices Have Been Falling
The decline in oil prices in the past few weeks is critical because the boost in December headline CPI caused by higher energy inflation was partially why real wages fell significantly. There was a very big decline in real production and non-supervisory wage growth. Oil prices are beginning to face higher yearly comps while energy inflation will face very easy comps. Specifically, energy inflation was -4.8% in January and -5% in February 2019. It increases to -0.4% in March. Based on this, headline CPI should be above core CPI in the next 2 reports.
The good news for workers is oil prices have been falling. The average annual change in WTI is -7.08% ($59.62 per barrel average) and the average annual change is 6.06% in Brent ($66.05 per barrel average). In January 2019, WTI was $54.92. In February and March, it was $58.19 and $60.8. The table below shows Brent oil prices are expected to stay near where they are now as the average expected annual average price is $67 in 2020, 2021, and 2022.
Conclusion
The Leading Economic Indicators and ECRI coincident index show growth was weak in December. That’s likely correct as Q4 GDP growth estimates are looking weak especially without the benefit of trade. Because of the retail sales and industrial production reports, JP Morgan lowered its Q4 GDP growth estimate from 2% to just 1.5%. This current Leading Indicators scenario isn’t good for stocks, but that could change in January. Q4 EPS growth is in the low to mid-single digits; growth is expected to improve in Q1 and Q2. Oil prices have recently been falling. Let’s see if that counteracts the very easy energy inflation comp in the January CPI report.
Have comments? Join the conversation on Twitter.
Disclaimer: The content on this site is for general informational and entertainment purposes only and should not be construed as financial advice. You agree that any decision you make will be based upon an independent investigation by a certified professional. Please read full disclaimer and privacy policy before reading any of our content.


