UPFINA's Mission: The pursuit of truth in finance and economics to form an unbiased view of current events in order to understand human action, its causes and effects. Read about us and our mission here.
Reading Time: 6 minutes
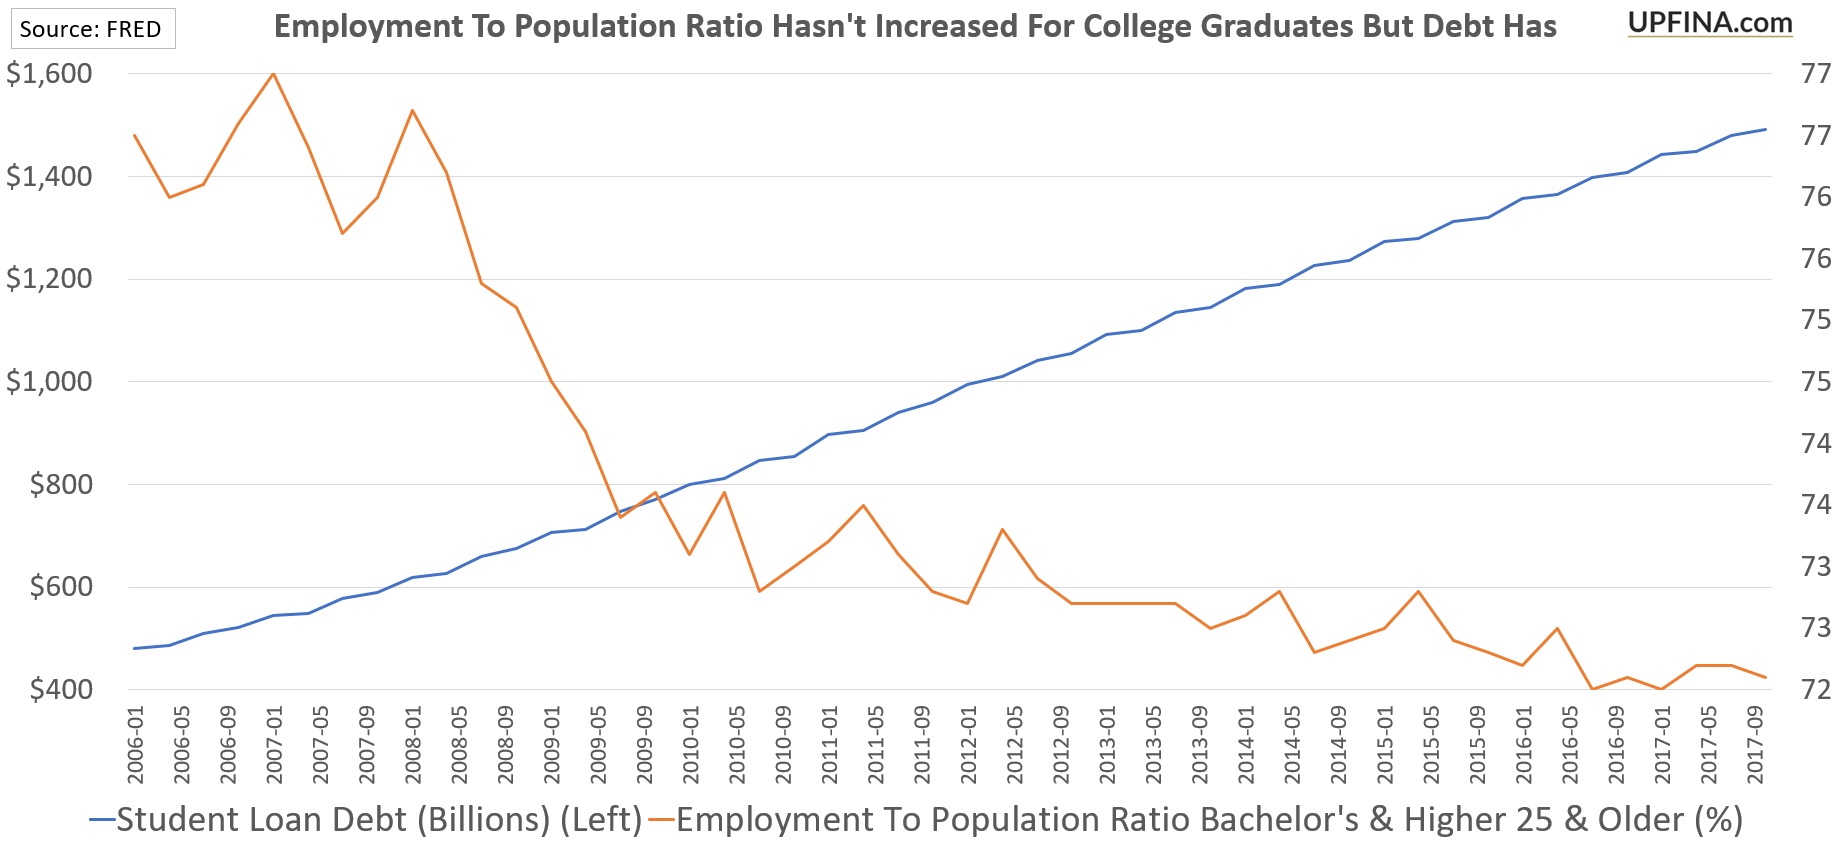
The problem with the labor market for the millennial generation is young adults need to get a college degree for jobs that previously didn’t require them. Four years of education and about $35,000 in debt later, young people are ready to enter the labor force. The chart below shows the tough situation young people are faced with.
Student debt has soared to about $1.5 trillion, while the labor participation rate for those who are 25 years or older and have a Bachelor’s degree has fallen and hasn’t recovered. Twenty years ago, getting a college degree was a distinguishing factor for prospective employees. Now it is the minimum requirement for most jobs. This is partially why diversified work has become popular as the standard requirements can be lower for those jobs. If you set a contract, the deal depends on if the worker can complete the task, rather than the qualifications on paper like a degree.
Labor Participation Rate
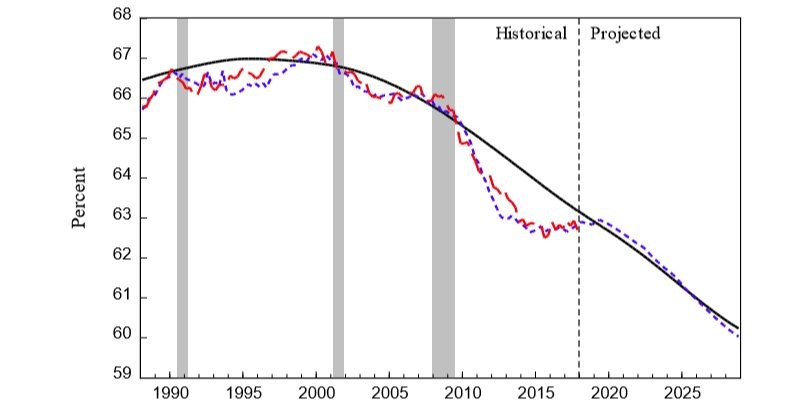
Sometimes the labor participation rate becomes a political football aimed to support the narrative that the economy is weakening. The reality is most of the decline has been caused by demographics. The aging population is why the chart below shows the forecast for the labor participation rate is expected to fall below 60% by 2030. This decline is daunting because healthcare costs have been increasing quickly. Therefore, fewer workers will have to support more older people who will be using more expensive healthcare.
The government needs to reign in healthcare costs through deregulations by allowing the free market to be more competitive. Additionally, the government will possibly be forced to raise the retirement age to account for this problem which will increase the deficit in the next 10 years. Keep in mind, there are already more workers than ever who are over 55, yet the participation rate has still been declining. It’s possible that in future generations people will be able to work longer because fewer jobs will be physically intensive due to automation. Another aspect to consider is that the 55 and older demographic has the lowest wage growth. This is why analysis of wage growth adjusts for demographic changes to provide an apples to apples comparison.
The chart below shows the labor force participation rate for prime aged workers.
As you can see, the decline is much less severe than the overall rate because it adjusts for the aging population. The projection has the rate staying steady, but obviously, it will be impacted by changes in the business cycle. It’s entirely possible that the rate increases in the next few years as the labor market fully recovers from the recession in 2008 which was so massive it’s fair to call it a once in a generation event.
Slower Labor Force Growth
Labor force growth has been responsible for 50% of the GDP growth in the U.S. from 1950 to 2015. There was a 1.3% increase in growth in people ages 16 and older. The female participation rate increased 0.4% and the male rate fell 0.3%. The net labor growth was 1.4% which is half of the 2.8% growth. The other half came from productivity growth. The low GDP growth this cycle has come from a decline in population growth and a decline in productivity growth. The chart below shows the historical labor force participation growth rate compared to the future projections. As you can see, the growth rate will be less than half the average from 1950-2015.
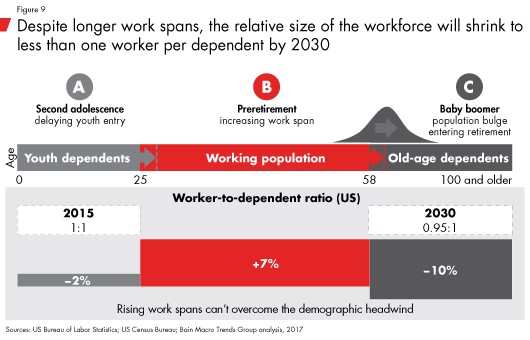
As we mentioned previously, more workers than ever are in the 55 and older age range. The chart below shows the effect of changing work spans.
As you can see, because young people are getting educated instead of entering the workforce, the workforce to dependent ratio will fall by 2%. Because workers are staying in the labor force longer, the workforce to dependent ratio increases by 7%. The size of the baby boom generation combined with the fact that they will live longer will cause the workforce to dependent ratio to decline 10%. In total, the workforce to dependent ratio will decline by 5% by the year 2030. As we mentioned when we showed the labor force participation rate, this will put pressure on the government because tax revenues will decline and spending on healthcare will increase.
Automation’s Effect On The Labor Market
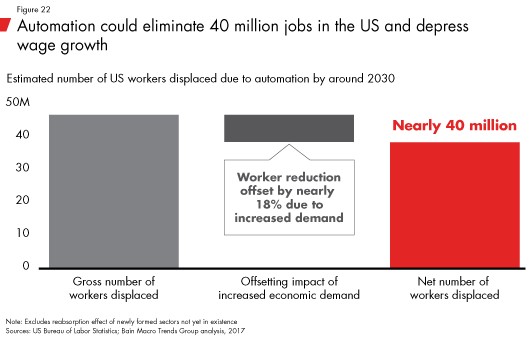
On the bright side, automation increases productivity and makes work less physically demanding. However, it will displace a lot of workers, potentially more than any other technological boom in the past. The chart below shows the estimated number of workers displaced due to automation by 2030.
There’s only an 18% decrease in the worker reduction because of increased demand. If these jobs are eliminated, it will hurt the labor force participation rate and wage growth. That being said, this is just a forecast. Past weak economic periods and improvements in technology haven’t led to a permanently suppressed labor force to participation rate. New industries have continually been created, supplying new jobs. For example, the telecom industry of today went from providing phone service to internet, phone, and TV. The next great innovation which provides jobs in the next 20 years might be space exploration.
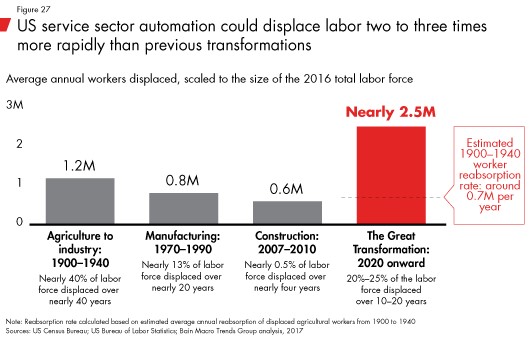
The chart below gives more context into the potential worker displacement over the next 10 to 20 years.
The number of workers displaced is scaled to the 2016 labor force. As you can see, this coming displacement of 2.5 million workers per year is double the rate of displacement from 1900 to 1940 when the agricultural industry became more technologically advanced. This great transformation will displace 20% to 25% of workers in the next 20 years. Using the same reabsorption rate as the 1900s, there will still be 1.8 million workers per year out of a job. We’re not saying that space or any other industry will create enough jobs to make up for this shortfall, but it’s worth noting that NASA has plans to have people sent into low orbit of Mars by the 2030s. This leads to a space boom as space becomes commercially viable.
Conclusion
This article discussed the changes in the work force which have occurred because of demographics and because employers are requiring more education to get a starting job. Automation is projected to kill a massive amount of jobs, but there will be new industries which we might not fathom now that will create new jobs, offseting some of the job losses caused by automation. Automation allows humans to be free to do more complex and intellectually stimulating tasks instead of repetitive physically demanding tasks. As the quality of life improves for everyone, should we fear automation?
Have comments? Join the conversation on Twitter.
Disclaimer: The content on this site is for general informational and entertainment purposes only and should not be construed as financial advice. You agree that any decision you make will be based upon an independent investigation by a certified professional. Please read full disclaimer and privacy policy before reading any of our content.

