UPFINA's Mission: The pursuit of truth in finance and economics to form an unbiased view of current events in order to understand human action, its causes and effects. Read about us and our mission here.
Reading Time: 4 minutes
The supply chain is normalizing steadily which is about to ruin part of the inflation thesis. Of course, home rental inflation will pick up the baton next. As you can see from the chart below, the number of anchored ships off the California coast has fallen by 75% since the peak in February. The fact that there are any shows there is still a problem. When firms report earnings in the next few weeks, they will mention that the supply chain was terrible in Q2, but that it will normalize in the 2nd half of the year. All the price increases enacted due to extra supply chain costs will potentially help margins depending on how other costs change. The biggest incoming cost increase in the next few quarters will be labor.
Good Start To Earnings Season
Speaking of earnings, with the first 10 S&P 500 firms reporting their Q2 results, average EPS and sales growth were 90.9% and 27.3%. Of course, the comps are very easy. This simply justifies the stock rally off the low in March 2020. It took until now to disprove the bearish thesis on stocks late last spring/early summer. The bears have already come up with new reasons to be negative now.
Back then they believed the pandemic wouldn’t be resolved quickly. Now they think valuations are too high. It’s very tough to be bearish on valuations if you were bearish when assets were much lower. That’s not to say that there isn’t a case to be cautious based on prices. It’s a moderate concern for the bulls which will only turn into a negative if the economy slows more than expected.
It’s incorrect to be bearish simply because earnings growth will peak. No one thinks EPS growth of 90.9% is sustainable. The market would be much higher if anyone thought that. You can’t pick a straw man argument to oppose your thesis. It’s dishonest. That will only hurt you in the end.
Spending Expectations Are Strong
As you can see from the chart below, expected spending growth in the next year is high which shows consumers are feeling confident again. They should be confident since the pandemic is nearly over and the labor market is filling up. Many industries are experiencing high wage growth already.
As you can see, spending growth estimates are back to where they were in 2013. Of course, actual retail sales growth won’t top the cycle peak which was boosted by fiscal stimuli. Income growth expectations rebounded back to pre-pandemic levels. Don’t be concerned with the discrepancy between the two. Consumers repaired their balance sheets during the pandemic. This was the only good part about it.
Consumers Are Ready To Roll
Some consumer metrics didn’t look great heading into the pandemic even though the labor market had been full. Any potential ramifications have been cast aside now that consumers spent less for a year and earned money from the government. White collar workers got paid well working from home and didn’t need to spend money commuting or buying work clothes.

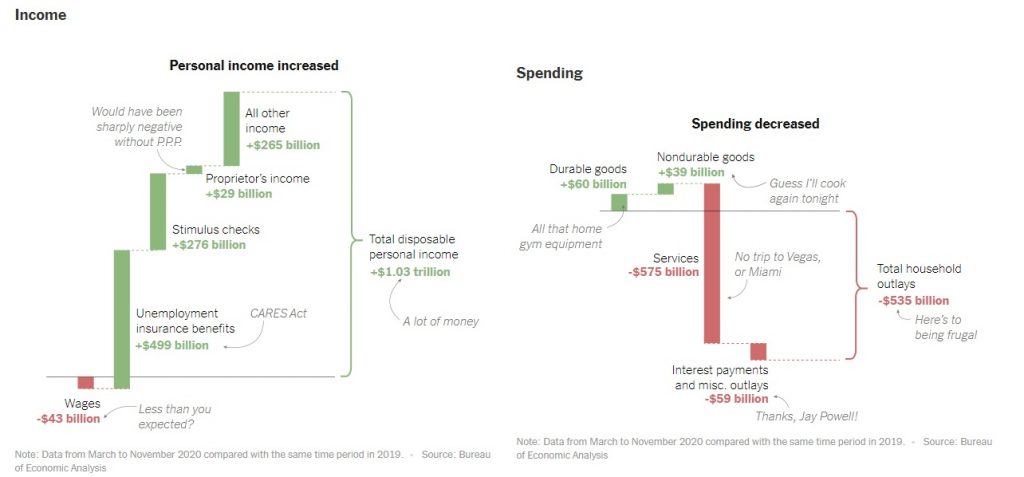
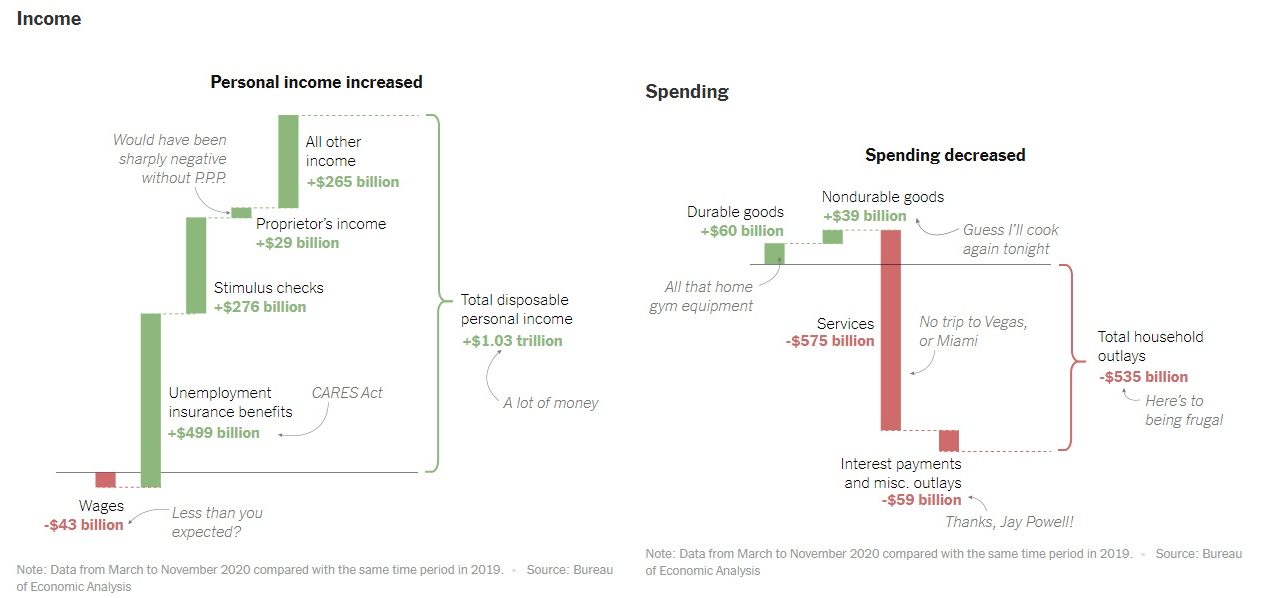
As you can see from the chart above, households had a massive increase in personal income from March 2020 to November 2020. Instead of spending it, they had a large reduction in spending (less spending on services). Think of the impact of a similarly targeted fiscal stimulus in helping people outside of a pandemic. The policies in 2020 weren’t a one off. More fiscal spending will occur in future recessions and even in expansions.
Some economists have the current situation in reverse. The government is not suppressing yields because the deficit is too high. Instead, rates are so low (because of low population growth) that the government can spend more than usual. The 10 year yield has been falling for 40 years. It’s possible that the government goes too far, but that discussion will only be had after rates rise sustainably. The 10 year yield couldn’t even get to 2% with a massive spike in growth and inflation in the past few months.
The Reverse Of The Housing Bubble
The rise in housing prices is the only similarity to the bubble in the early 2000s. The biggest difference is that lending is tight and well qualified buyers are bidding for homes. Supply is tight because of demographics, not because of speculation. In fact, this is the best swath of home buyers ever in terms of credit scores and income.
As you can see from the chart below, in the 2000s bubble there was a massive overhang of newly competed homes right into the burst. Unfortunately, it takes time to build a house which means homes were being completed at the worst possible time and nothing could have been done to stop them from coming onto the market.
This time is a lot different. It’s actually the exact opposite because the number of completed homes fell dramatically at the worst possible time because demand was so strong starting last spring. The spike in the number of homes not started shows us that the number of completed homes will be very strong in 2022. By then, demand won’t be as strong, but it should still be solid. The worst possible scenario next year would be labor market weakness and higher rates just as supply increases. However, the more likely scenario is an increased supply of homes for millennials in their 30s looking to buy their first home.
Conclusion
The supply chain will be normalized in the 2nd half. 75% of the ships waiting off the coast of California are already gone. The start of Q2 earnings season has been perfect. Expect more great results in the next few weeks. Households expect to spend a lot more in the next year. They can because they saved a ton in 2020 and earned more. However, the peak in retail sales growth has already occurred since the stimulus is over for now and the easy comps have passed. The supply/demand dynamic in the housing market is the exact opposite of 2007 even though prices are rising fast like the lead up to the burst in the 2000s.
Have comments? Join the conversation on Twitter.
Disclaimer: The content on this site is for general informational and entertainment purposes only and should not be construed as financial advice. You agree that any decision you make will be based upon an independent investigation by a certified professional. Please read full disclaimer and privacy policy before reading any of our content.


