UPFINA's Mission: The pursuit of truth in finance and economics to form an unbiased view of current events in order to understand human action, its causes and effects. Read about us and our mission here.
Reading Time: 5 minutes
Friday was a terrible day for economic data as we will review in this article. The disappointing August real consumption and core capital goods orders growth caused many Q3 GDP growth estimates to plummet. Oxford Economics’ estimate fell from 1.8% to 1.3%, Morgan Stanley’s estimate fell from 2.1% to 1.5%, and Macro Economic Advisors’ estimate fell from 2.2% to 1.6%. The NY Fed’s estimate fell from 2.24% to 2.04%. The Atlanta Fed’s estimate rose from 1.9% to 2.1% because there were a few great housing reports since its last update on the 18th. The consensus is for about 2% growth.
OK Income Growth, But Disappointing Spending Growth
For some context, the U.S. consumer is slightly larger than the entire Chinese economy. The weak August University of Michigan consumer confidence index was wrong about retail sales growth which was solid, but was correct in predicting weak real consumption growth. The fact that income growth was higher than consumption growth, which pushed the savings rate higher, signals consumers lost some confidence. However, we can’t read too much into this since it only brought the savings rate back to where it was in June.
Specifically, August monthly personal income growth was 0.4% which met estimates. Real yearly disposable income growth improved 5 basis points to 3% and real personal income growth fell 1 basis point to 3.1%. The chart below shows income growth wasn’t exactly strong.
It’s in between the 2018 peak and the 2016 trough and it’s trending in the wrong direction. Real consumption growth was pretty bad. Monthly growth was 0.1% which missed estimates for 0.3%. Yearly growth fell 23 basis points to 2.27% which was the weakest reading since the very bad December growth rate of 1.69% which was the lowest growth since January 2014.
If there is going to be weak consumption growth, we’d rather see income growth be stronger than consumption growth and the savings rate go up because when confidence improves, spending growth can improve. There’s some firepower in the tank. Specifically, the personal savings rate rose 0.3% to 8.1% which is the highest since June 2019. We wouldn’t make the case that the consumer is extremely uncertain, but at the margin, combined with not great income growth, the decline in confidence was a factor.
As We Expected, Core PCE Inflation Didn’t Surge Higher
August core CPI increased from 2.3% to 2.4% which caused many to fear inflation and criticize the Fed’s rate cuts. It seems like those saying inflation is a problem are also bearish on economic growth. You can’t have it both ways with criticizing the Fed’s rate cuts. There is a strong case to be made the economy is in a slowdown as the PCE report and core capital goods orders suggest. The Fed reacts to core PCE inflation when setting policy and it’s not problematic yet (as we previously suggested).
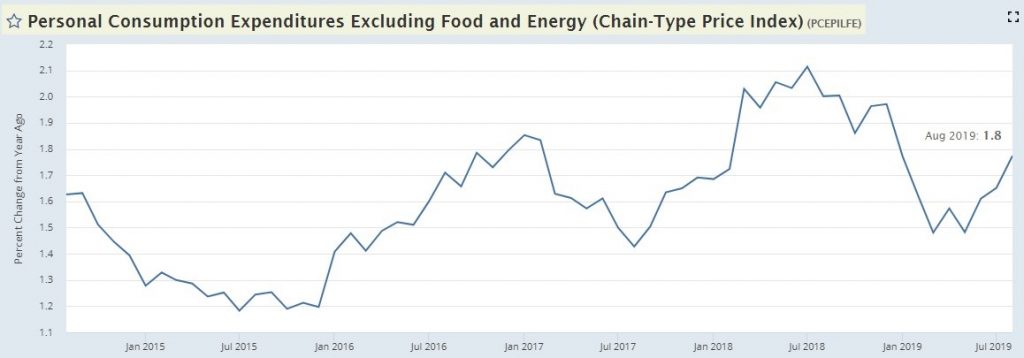
Specifically, headline August PCE inflation was 1.4% which was the same as July and missed estimates for 1.5%. As you can see from the chart below, core PCE inflation was 1.8% which met estimates and increased from the upwardly revised 1.7% (from 1.6%) reading in July.
This improvement in August was mostly due to easier comparisons as the comp got 11 basis points easier and core PCE increased 12 basis points. Core PCE inflation could be a problem in early 2020 because the comps get much easier. Inflation depends on cyclical growth. It would be a high quality problem for core PCE to be modestly above 2% because economic growth is improving. The Fed has been longing for 2% inflation this entire cycle as it has been rare. An end to the economic slowdown would obviously be great.
August Durable Goods Orders
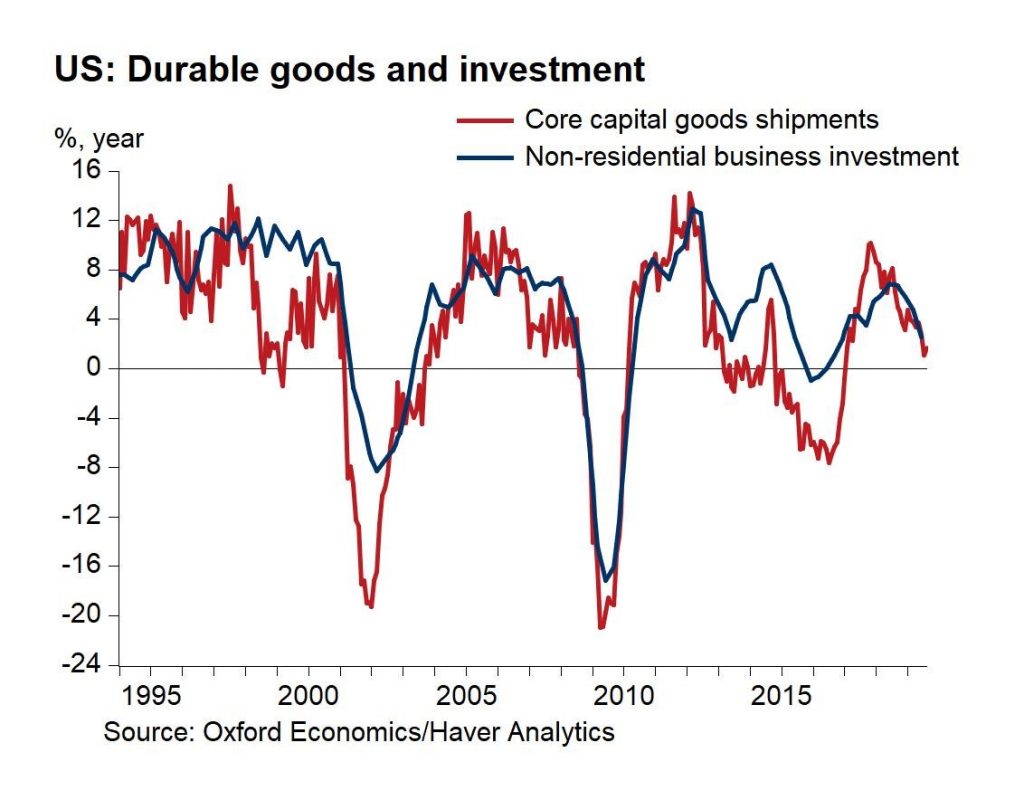
The August durable goods orders report had great headline new orders growth, but weak core capital goods orders growth. The latter is the best representative of business investment. As you can see from the chart below, core capital goods shipments growth has been highly correlated with non-residential business investment growth.
Shipments, not orders, get put into GDP since they are the result of production. Monthly shipments growth was 0.4%, but that didn’t offset July’s 0.6% decline. Yearly shipment growth was just 1.7%.
Weak business investment combined with weak consumption growth is *not good* for Q3 GDP growth. That explains the estimate downgrades we discussed earlier. In Q2 business investment growth went from helping GDP growth by 0.6% to hurting it by almost 0.2%. That was the worst impact since Q4 2015. Oxford Economics sees flat business investment growth in Q3 after the 1% contraction in Q2.
Specifically, headline monthly new orders growth was 0.2% which was strong because of the 2% comp in July; it beat estimates for -1.2%. Ex-transportation monthly growth was 0.5% which beat estimates for 0.2% and July’s -0.5%. July was boosted by transportation as it had 7.2% growth. It fell to -0.4% in August. That’s because monthly commercial aircraft orders growth was -17.1% and motor vehicles and parts orders fell 0.8%. The grounding of the 737 Max is why yearly commercial aircraft orders growth was -37.3%. At least motor vehicle and parts yearly growth was 5.9%.
Core Capital Goods Orders Weakness
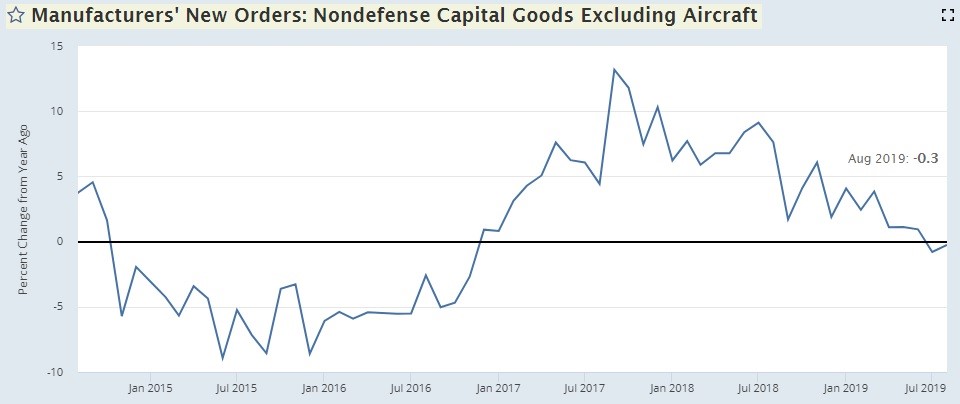
July monthly core capital goods orders growth was revised lower from 0.4% to 0%. Even with that terrible negative revision, monthly growth missed estimates for 0% as it was -0.2%. As you can see from the chart below, yearly growth in both months was negative as it improved from -0.8% to -0.3%.
The good news is growth will likely improve in September because the comp goes from 7.6% to 1.7% growth. Current growth is nowhere near the -8.9% trough in June 2015. Monthly orders for electrical equipment, appliances, and components fell 1.3% which was the most since November 2018. Orders for machinery were up 0.6%.
Conclusion
After a great run of housing reports, industrial production growth that beat estimates, and accelerating growth in retail sales, weak data was released on Friday. Weakness in real consumption and core capital goods orders growth put a large damper on Q3 GDP growth estimates. Q3 growth could come in below 2%. At least real income growth wasn’t terrible, leading the savings rate to increase.
Have comments? Join the conversation on Twitter.
Disclaimer: The content on this site is for general informational and entertainment purposes only and should not be construed as financial advice. You agree that any decision you make will be based upon an independent investigation by a certified professional. Please read full disclaimer and privacy policy before reading any of our content.


